This is the second in a series of blog posts written for D3 developers interested in network visualization.
Read part 1: Graph visualization with D3 and KeyLines
Read part 3: Advanced graph visualization with D3
In my post on Graph visualization with D3 and KeyLines, we started building a basic network visualization. This time we’ll look at the next steps – including customizing our network’s appearance and adding auxiliary visual elements.
Let’s take a look at some of the functional differences you should know about if you’re comparing KeyLines, our JavaScript graph visualization toolkit, with D3…
You’ll need a KeyLines account to follow the steps in this blog post.
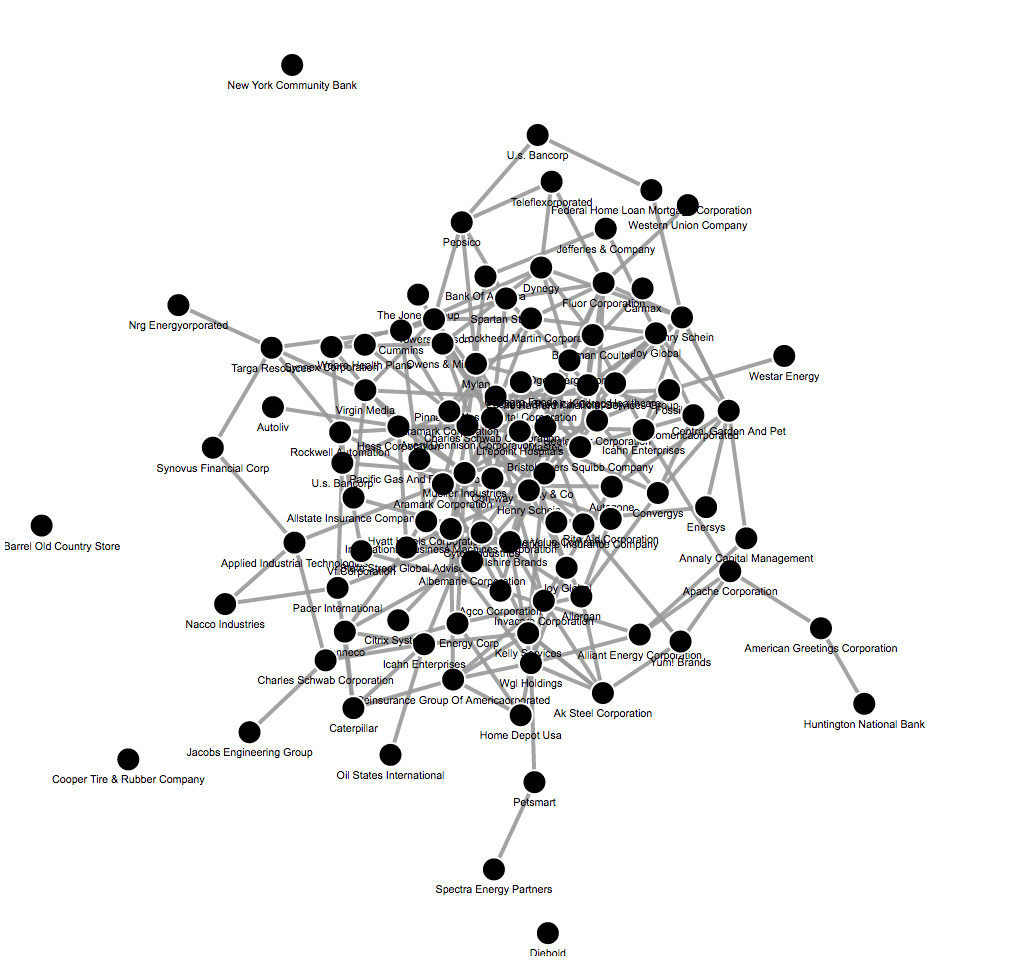
Adding node labels
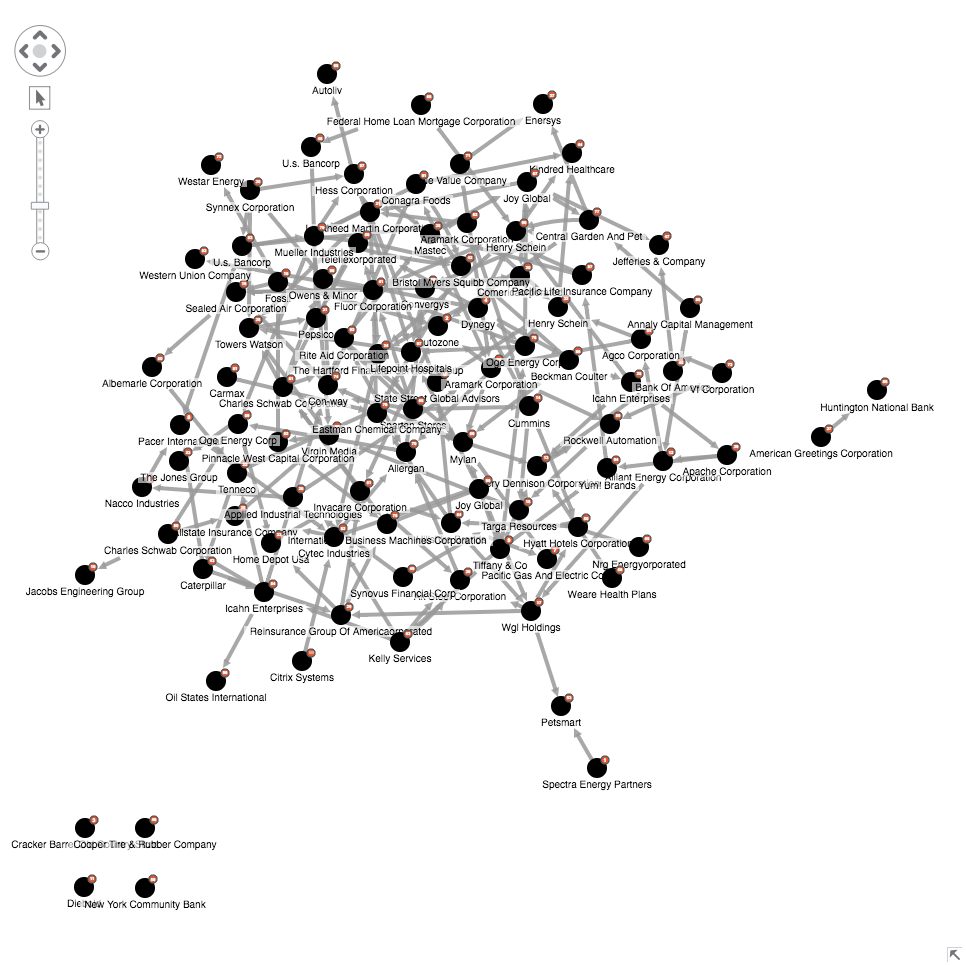
Last time we applied simple force-directed layouts to our networks, binding the data to gracefully arrange nodes and links. This means you can start to find patterns, such as clustering, singletons (isolated nodes) or network symmetry. To begin making sense of these patterns users will normally look for labels (text element to show some distinct node data) so this is the first feature we will explore.
Adding node labels with D3
Probably the best labelling option in D3 is to create an svg:g element to group the node circle and its label. This requires you to append the svg:circle and text elements to the group. You can use the .text method to access node names stored in data and display them, like this:
const node = svg.selectAll(".node")
    .data(data.nodes)
    .enter()
    .append("g")
    .attr("class", "node")
    .call(drag);

const nodeLabels = node.append("svg:text")
    .attr({
        "class": "node-label",
        'dy': 24,
        "text-anchor": "middle"
    })
    .text(d => d.Name);
Text style can be controlled in the css style sheet, while text position is managed in JavaScript. For instance with dy and text-anchor you can have central labels at the bottom of the nodes.
Additionally, you will need to change the tick function in order to move the new node groups:
node.attr("transform", d => `translate(${d.x}, ${d.y})`);
To accomplish that, instead of changing cy and cx (positions of circles’ centers), you will need to create a CSS transformation to translate each group element across x and y-axis by amounts calculated by the layout (SVG groups don’t have coordinates on their own). All in all, it’s a fairly tricky bit of coding, requiring changes to many parts of the code to introduce the complexity of groups.
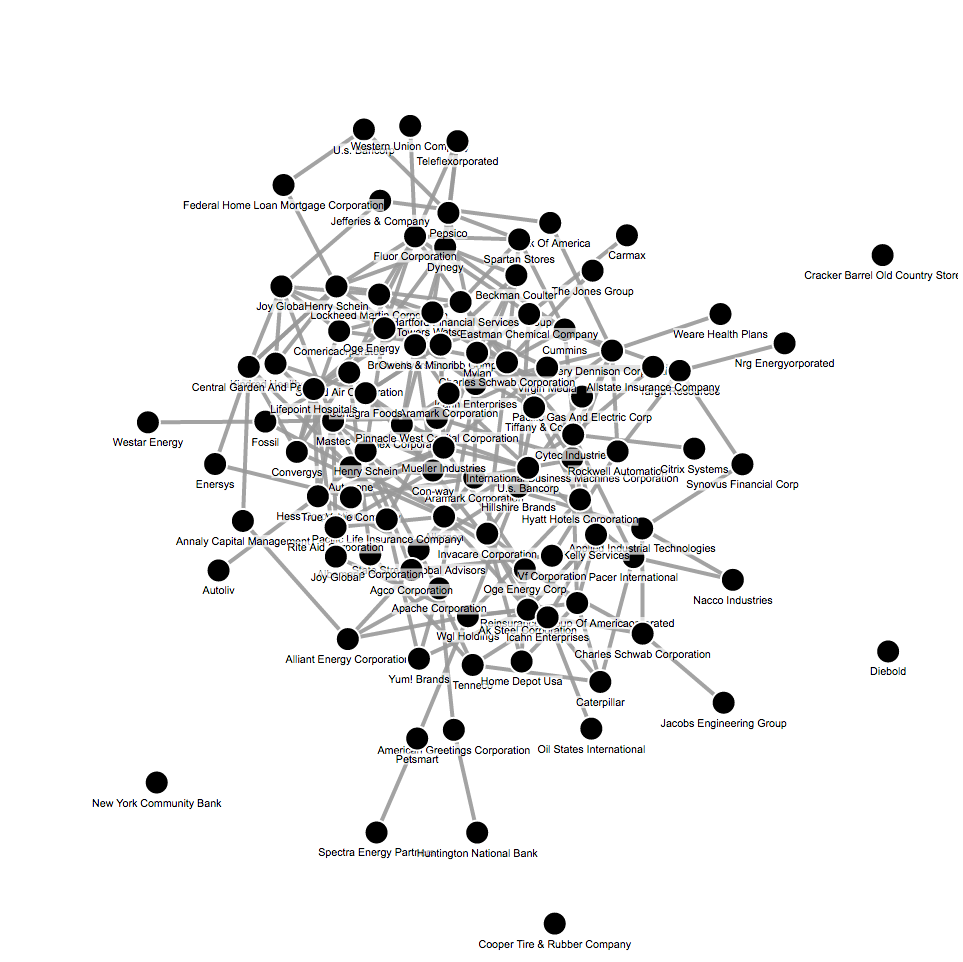
The result is quite nice, but labels in the center of our graph are unreadable. They need a white background. This is not trivial since svg text has no background property and we need to create a rectangle with the correct dimensions in order to simulate the background.We can do this using the getBBox() method:
const nodeLabels = node.append("svg:text")
    ...
    .call(getBBox);

function getBBox(selection) {
    selection.each(function(d) {
        d.bbox = this.getBBox();
    });
};


const textBackground = node.insert('svg:rect', 'text')
    .attr({
        'x': d => d.bbox.x,
        'y': d => d.bbox.y,
        'width': d => d.bbox.width,
        'height': d => d.bbox.height,
        'class': "bbox"
    }));
We use insert method, instead of append, because we need to insert the background rectangle before the text itself, otherwise it will not be visible (svg doesn’t have z-index, so you need to control it with item DOM positions).
Adding node labels with KeyLines
The KeyLines API has been designed to make these common functions as simple as possible.
To add node labels, the developers uses the t property in the data binding function:
const nodes = obj.nodes.map((node) => ({
    ...
    t: node.Name,
    tc: false
}));
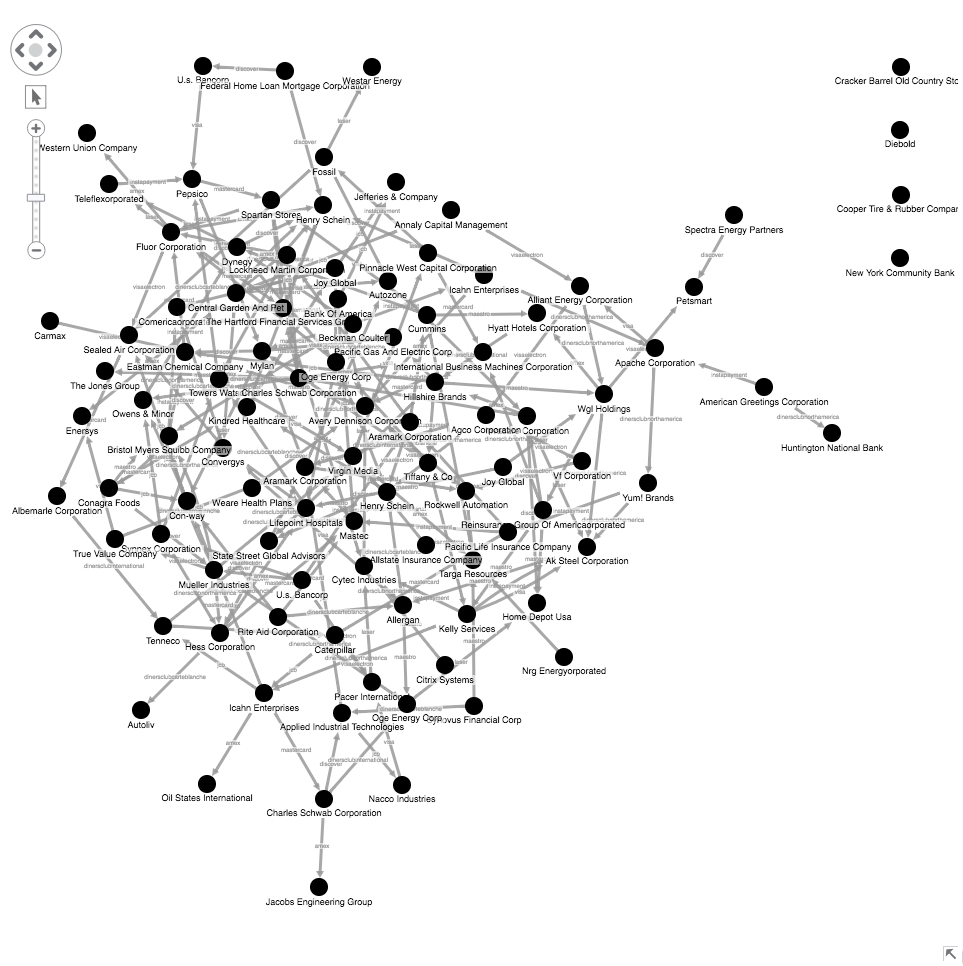
By default node labels are displayed in the center of the nodes, with a white semi-transparent white background:
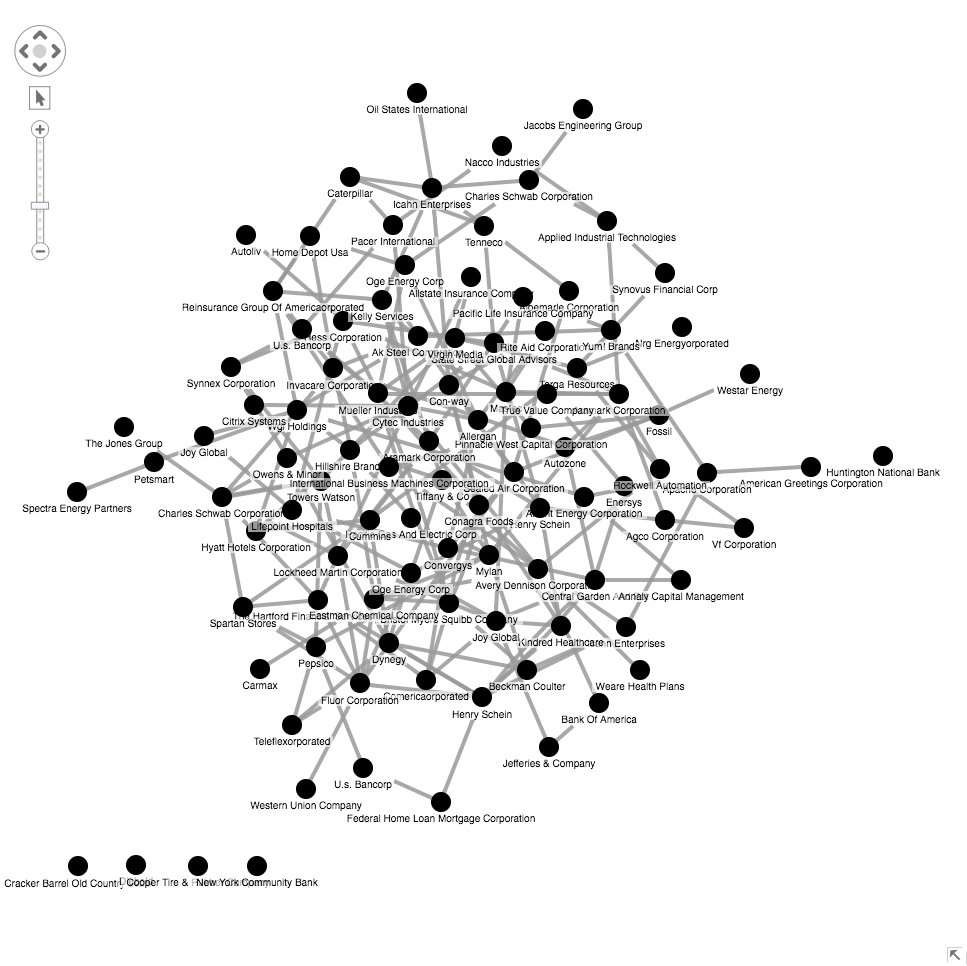
You can further customize your labels with various properties, options, and functions, with which you can change the label’s font-weight, color, family, size, background color, relative position (to node circle). You can also retrieve information about the label position of an item with a specified id. avoidLabels chart option controls whether link ends should avoid node labels (it’s switched on by default). truncateLabels allows to truncate labels with a nice ellipsis and to display the full label on hover.
These functions are difficult to replicate in D3.
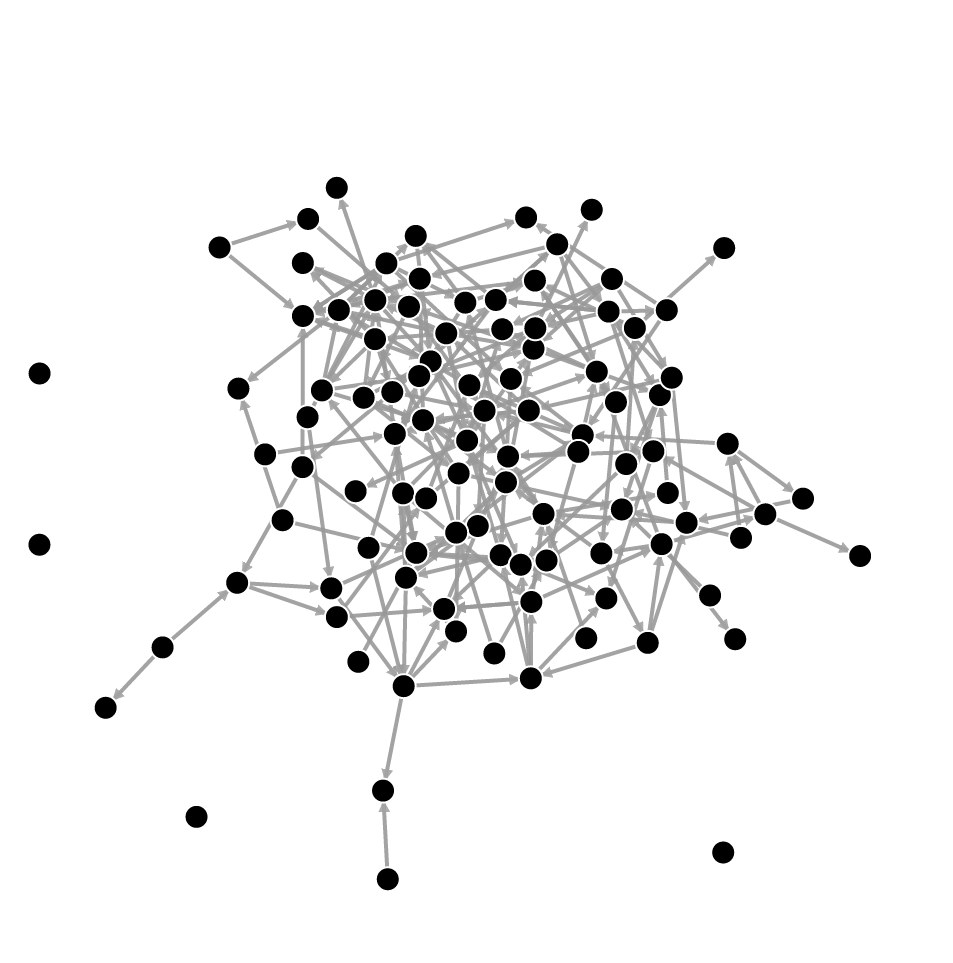
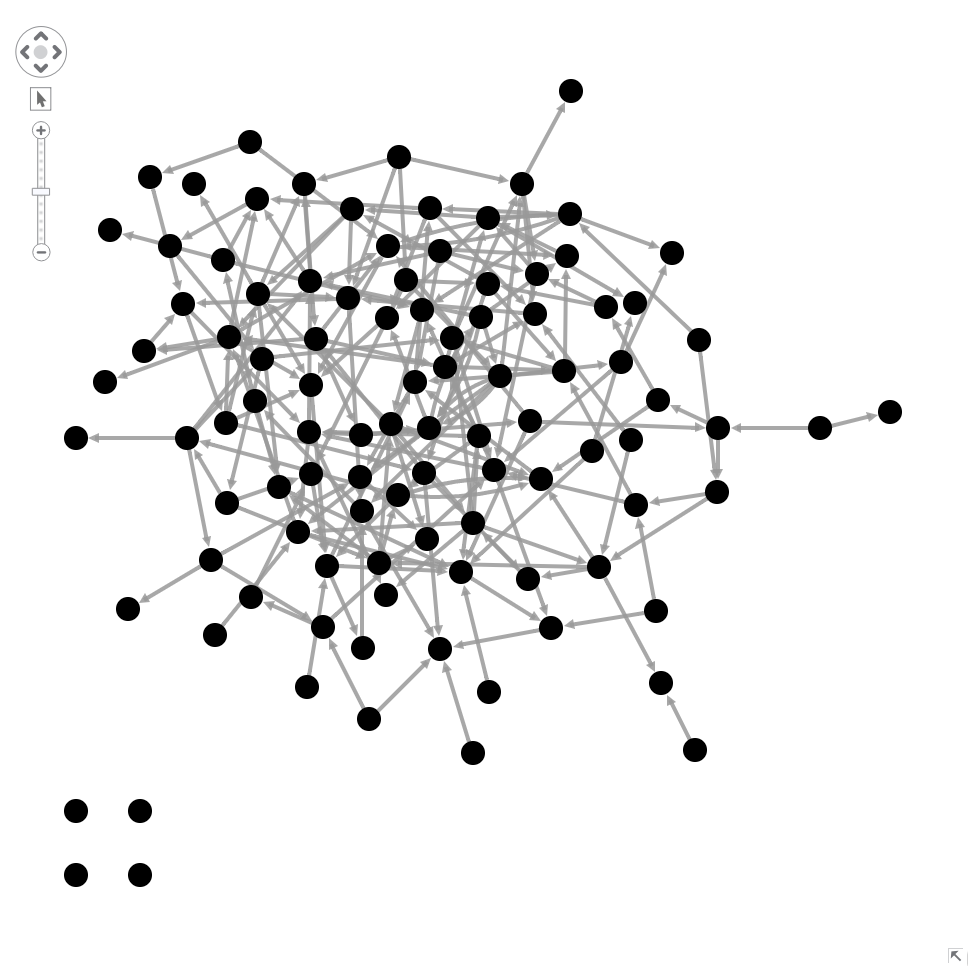
Adding arrows with D3
Another typical customization is to add link arrows – essential for understanding directed graphs.
Adding arrows requires a different logic compared to node labels. We need to define a svg marker element as a reusable item (using the defs tag). In theory this could be any shape, but let’s stick to a triangle:
svg.append("defs").selectAll("marker")
    .data(["end"])
    .enter()
    .append("svg:marker")
    .attr({
        "id": String,
        "viewBox": "0 -5 10 10",
        "refX": 18,
        "orient": "auto"
    })
    .append("svg:path")
    .attr("d", "M0,-5L10,0L0,5");
This definition doesn’t show anything in the visualization, so we need to append an instance of it to each link:
const link = svg.selectAll(".link")
    ...
    .attr({
        ...
        "marker-end": "url(#end)"
    });
Customizing arrows requires a thorough understanding of SVG shapes and some time to experiment. Let’s see how it works in KeyLines.
Add arrows with KeyLines
Again, the KeyLines API aims to make this common step as simple as possible, with specific properties to turn on link arrows for source and/or target ends:
const links = obj.links.map((link) => ({
    ...
    a2: true
}));
If you need to customize the standard arrow, there are some options – for example arrow sizing, and distance from the node. Here, the KeyLines developers have taken some design choices for you, which make it easier to follow best practice whilst still giving you some flexibility to tell a compelling story.
Adding link labels
There’s a good chance you also want to add link labels – let’s briefly see how that works in each visualization library.
Adding link labels with D3
With D3 you need to append a new text element to links, but you can’t just append a g element to group line and text, the way we did with nodes. Link lines positioning require two points coordinates (x1,y1 and x2,y2) while groups have no coordinates at all and their positioning needs a translation in space. Instead, we are going to create a new D3 selection just for labels, and use a different function to move it:
const linkLabels = svg.selectAll(".link-label")
    .data(data.links)
    .enter().append('svg:text')
    .attr({
        "class": "link-label",
        "text-anchor": "middle"
    })
    .text(d => d.Transaction);

function tick() {
    ...
    linkLabels.attr("x", d => ((d.source.x + d.target.x) / 2)
        .attr("y", d => ((d.source.y + d.target.y) / 2);
    ...
};
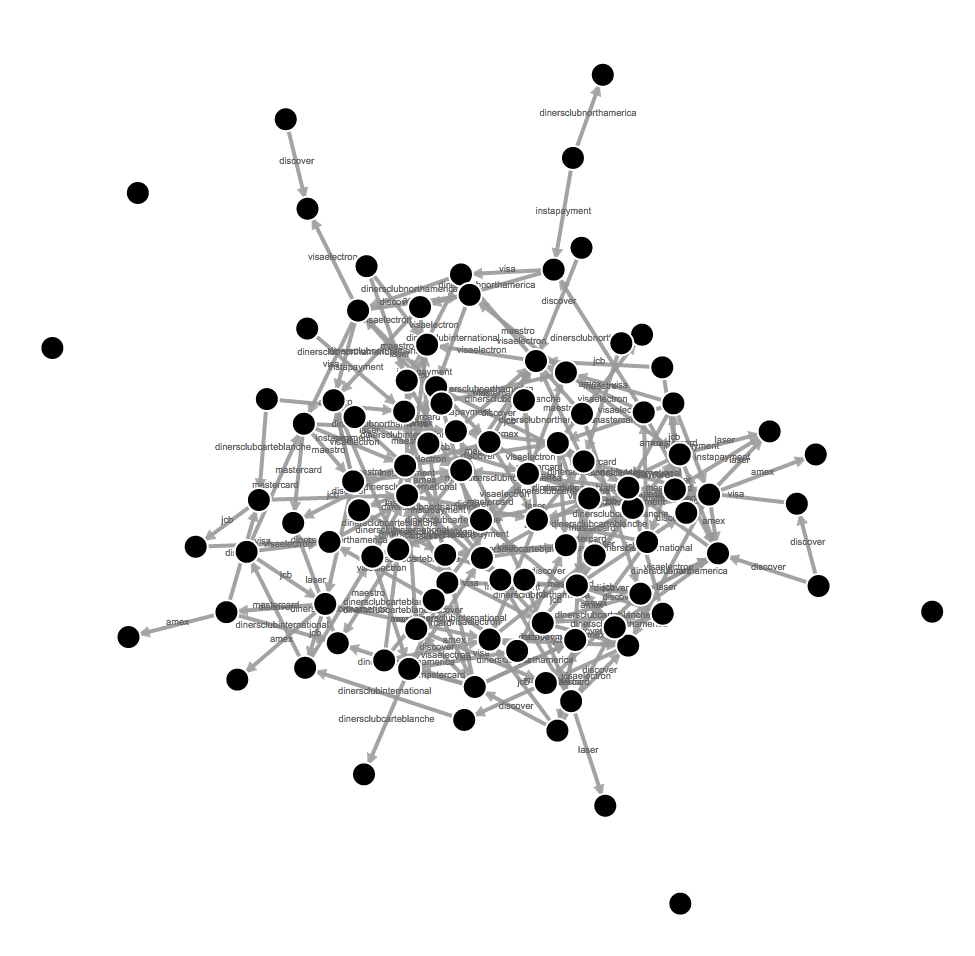
This way we can have link labels horizontal and in the middle of link. We can style labels with CSS.
D3 link labels can be customized in many different ways if you can write the appropriate code. For instance, they can be placed parallel to node links. It is challenging, though. Link labels are difficult to read on an angle, and the text rotation will lower your visualization frame rate.
Add link labels with KeyLines
As before, in KeyLines you can turn link labels on just using the corresponding property:
const links = obj.links.map((link) => ({
    ...
    t: link.Transaction
}));
Link labels are placed at the center of the link, and their size is relatively smaller than node labels by default. Font can be customized with the same attributes used for node labels.
In KeyLines link labels are always horizontal and centered. This is another specific design choice – following visualization best practice.
Adding node glyphs
Important information can be added as a glyph on nodes or links. This is commonly used to display counters or data attributes. Let’s see how we can create a glyph containing a number in D3 and KeyLines.
Adding node glyphs with D3
Adding node glyphs in D3 is similar to adding node labels. Append a new circle element and a new text element, give them some attributes and styles. Since they are already inside the node group element, they will be placed on the screen by the node tick function, but you will need to decide upon their relative position:
const nodeGlyph = node.append("svg:circle")
    .attr({
        "class": "node-glyph",
        "r": 5,
        "cx": 10,
        "cy": -10
    });

const glyphLabels = node.append("svg:text")
    .attr({
        "class": "glyph-label",
        "dx": 10,
        "dy": -9,
        "text-anchor": "middle"
    })
    .text(d => d.Id);
Again, we have the theoretical potential of D3 customization and we could change the aspect of the glyphs in many ways. It is beyond my development skills, however, to do some important things like extending the glyph to accommodate more text.
Adding node glyphs with KeyLines
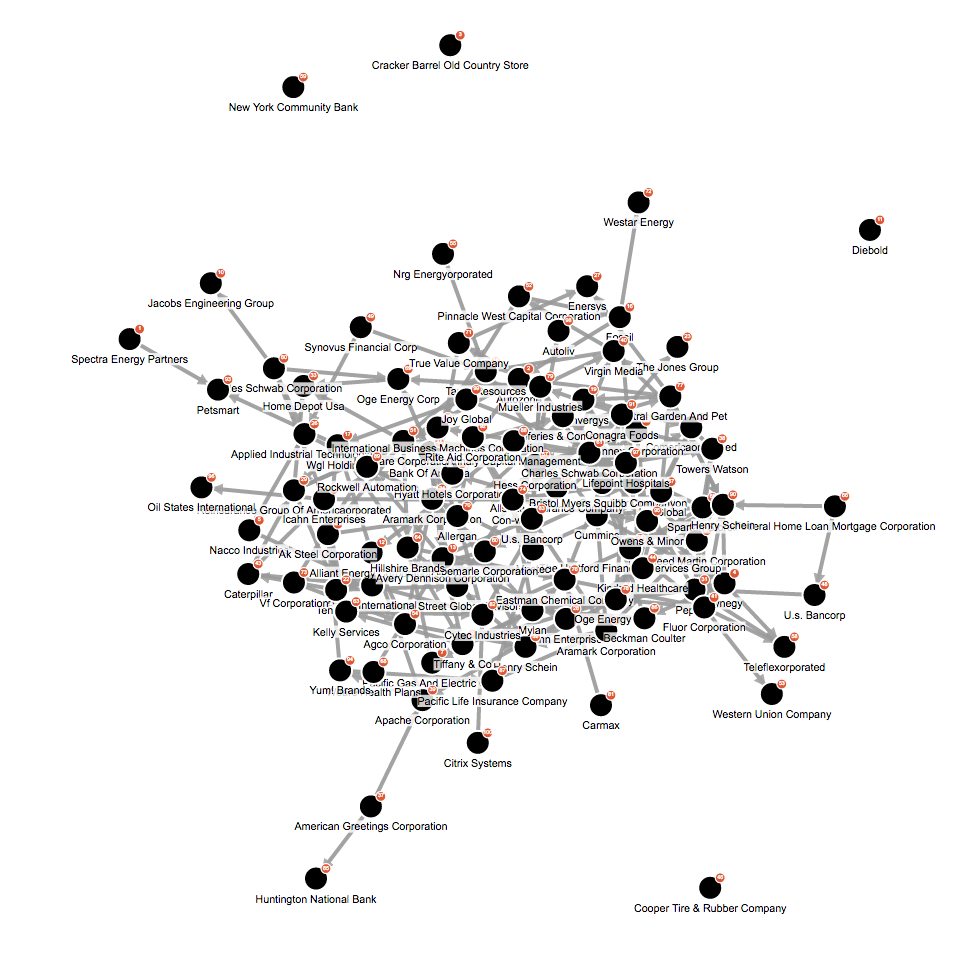
Glyphs are first-class citizens in KeyLines, for a good reason: they are very useful to display further node information such as a particular value, a flag, a symbol or a color while keeping the graph tidy and clean. You can add glyphs by simply using the g property.
const nodes = obj.nodes.map((node) => ({
    ...
    g: [{
        p: 'ne',
        c: '#de5835',
        t: node.Id
    }]
}));
As first-class citizens, glyphs come with some helpful out-of-the-box options. You can, for example:
- Add four glyphs to each node or link
- Add unlimited glyphs to links
- Position glyphs in the four cardinal positions (we like North East)
- Extend glyphs to accommodate more text
- Animate glyphs
- Customize the styling (background, border etc.) of each glyph
Etc. Despite some limitations, this simplicity means a KeyLines developer has a much wider scope of immediate flexibility than a D3 developer here.
Conclusion – flexibility vs best practice
As we make more progress with our D3 and KeyLines visualizations, there is a clear theme emerging: As a network-specific visualization toolkit, Keylines gives a simpler developer experience and makes it easier to follow best practices.
Another observation I have made whilst writing this post is that the D3 codebase is less consistent than KeyLines code. In D3 every bit of functionality needs to be implemented in a different way, increasing the development time and learning curve.
Stay tuned for my next post, advanced graph visualization with D3 (the last in this series), where I’ll try to take graph visualization to the next level with node selection, network analysis and advanced layouts.
Try KeyLines for yourself
If you want to try KeyLines and see how easy and fast it is to visualize your connected data, you can request a free trial.


