We’re delighted to announce the release of KeyLines 3.2 for all customers! We’ve made working with larger datasets quicker and easier. Enhancements include:
- Better filtering
- More flexible layouts
- A new graph engine
- Time Bar minScale option
- WebGL leaves Alpha release
- A new DataStax Enterprise Graph integration demo
Better filtering
We’ve made it much easier to use combos with filters, including the ability to filter items inside combos. Take a look at the updated Ransomware demo to see this new option in action.
It is also now easier to use filters with the expand function; meaning filters can be applied to new data as it is added to the chart.
More flexible layouts
Multiple enhancements have been made to layouts to improve their usefulness and readability:
- expand mode, previously only available for the standard layout, is now also available for hierarchy, radial and tweak layouts. See the Incremental Layout demo for more.
- a new ‘consistent’ option means you can reload layouts, or add chart items, without your existing data shifting unexpectedly.
- a clearer hierarchy layout with longer links, producing easier to read views:
A new graph engine (Beta)
This engine means you can now run graph calculations without waiting for the result to render in a KeyLines chart. With this engine, you can:
- run the Graph Engine on a different server using Node.js
- filter the dataset to display only the items you need to analyze.
The result is a faster, more responsive end-user experience.
The Graph Engine is in Beta development. Your feedback will help shape the future of this feature, so we’d love to hear your thoughts. Get in touch with our Support team, or your account manager, with feedback.
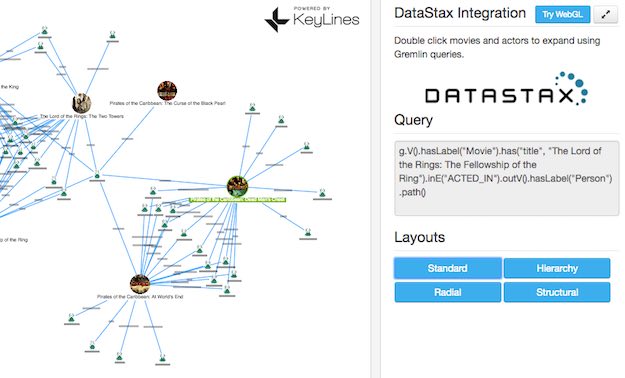
DataStax Integration
Our new demo showcases the combination of KeyLines with the DataStax Enterprise (DSE) Graph. You can use Gremlin queries to retrieve data and explore combined relationships in vast datasets.
To see the power of a KeyLines – DSE Graph combination, take a look at the new DataStax demo.
WebGL leaves Alpha
With help from you, we have been making improvements to our WebGL renderer. In v3.2, the component offers significantly improved rendering quality.
WebGL is still in Beta release; so keep sending us your feedback.
Time Bar minScale option
A new time bar option, minScale, lets users limit their zoom level, meaning they will no longer zoom beyond a useful level. This replaces the minRange option, which has been deprecated.
Farewell to Flash
After five years of faithful service, we have retired our Flash component. We announced this earlier in 2016, but as of 3.2 KeyLines no longer supports Flash.
Minor updates, enhancements and bug fixes
Including…
- a new undo/redo demo
- updated demos for Neo4j, OrientDB, Layouts, Fetch & Merge, Neo4j (filter)
- API changes to reflect new functionality listed above
- a fix for backgrounded RTL text in Canvas
- easier to use time bar slides for touch devices
- improved WebGL text, icon and node appearance
See the SDK changelog for a complete list of bug fixes.


