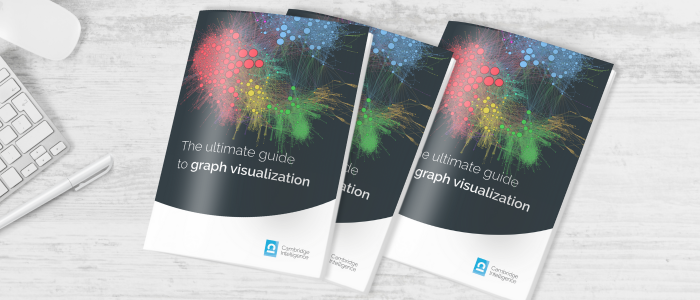
The ultimate guide to graph visualization
Download our guide to all things graph visualization: use cases, databases, modeling and techniques.

Use case overview:
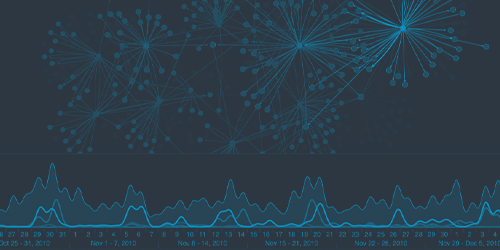
Mis/disinformation & online safety
A deep-dive into mis/disinformation and how graph and timeline visualization keeps us safe online.

Use case overview:
Artificial intelligence
How businesses are using graph visualization and AI technologies to uncover insights.
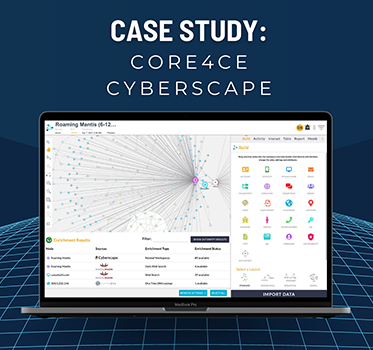
Use case overview:
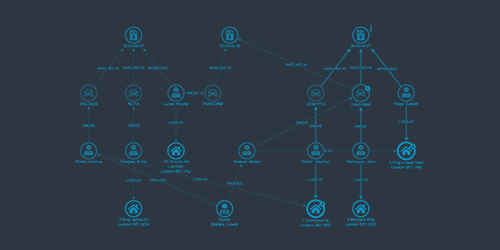
Cyber threat intelligence
Making sense of complex cyber security threats with powerful graph and timeline visualization tools.
Use case overview:
Fraud management
How our products power fast and effective fraud detection and investigation processes.
Use case overview:
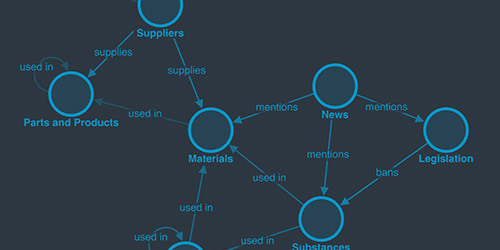
Supply chains
The ultimate guide to efficient, responsive supply chains using data visualization.
Use case overview:
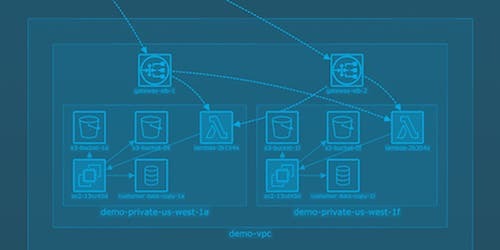
Cloud security
Understand your cloud threat landscape and mitigate risks using data visualization.
Use case overview:
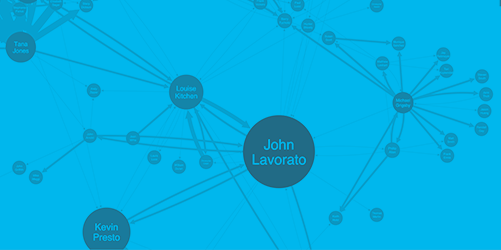
Social networks
How to visualize social networks, with an introduction to centrality measures.
Use case overview:
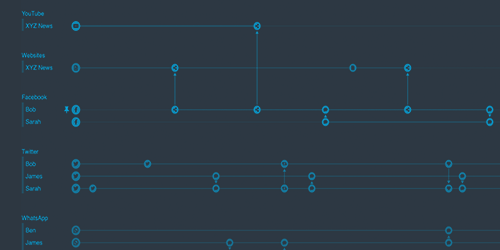
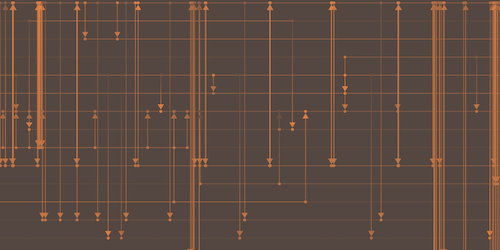
Time-based data
Learn about the challenges posed when visualizing time-based data.
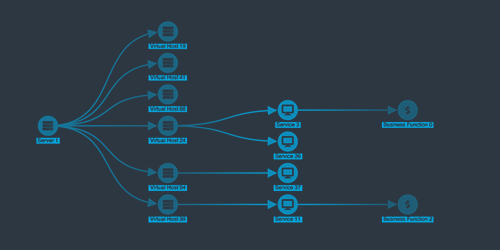
Use case overview:
Graph visualization
Everything you need to start building effective graph visualizations.
Use case overview:
Visual timeline analysis
A Product Manager’s guide to visual timeline analysis: what it is, and why it should feature on your product roadmap.

Industry overview:
Financial services
Risk and threat management in financial services with link analysis.

Industry overview:
Public sector
Risk and threat management in public sector with link analysis and timelines.

Industry overview:
Law enforcement
Powering better law enforcement investigations, incident response and resource deployment.

Buyer’s guide:
The buyer’s guide to graph visualization
Our guide to comparing graph visualization solutions, including a handy comparison template
Product overview:
KeyLines datasheet
A quick non-technical introduction to the basics of KeyLines.
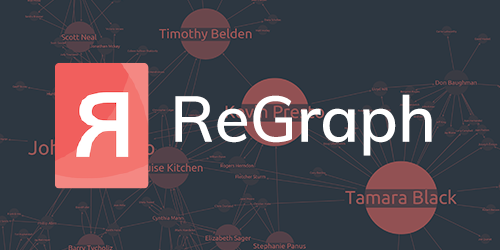
Product overview:
ReGraph datasheet
A quick non-technical introduction to the basics of ReGraph.
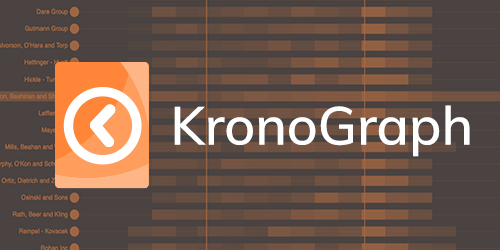
Product overview:
KronoGraph datasheet
A quick non-technical introduction to the basics of KronoGraph.
Product overview:
KeyLines white paper
A more in-depth introduction to KeyLines and graph visualization.
Product overview:
ReGraph white paper
A more in-depth introduction to visualizing graphs with ReGraph.
Product overview:
KronoGraph white paper
A more in-depth introduction to visualizing timelines with KronoGraph.

Analyst Report:
KeyLines & ReGraph
Our toolkits, rated, compared and analyzed by independent experts.

Analyst Report:
KronoGraph
An objective evaluation of KronoGraph, our timeline visualization toolkit.
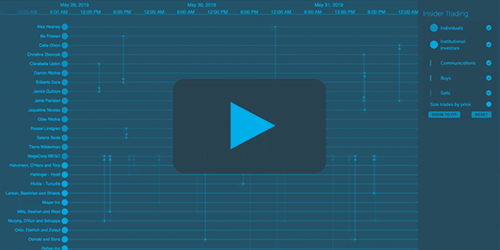
On-demand demo:
KronoGraph
Why and how you should visualize your data with KronoGraph, our timeline visualization technology.

On-demand demo:
KeyLines & ReGraph
Why and how you should visualize your data with KeyLines & ReGraph, our graph visualization technologies.