The ReGraph Toolkit
The React toolkit for graph visualization
Build game-changing React graph visualization products that turn connected data into insight.
With ReGraph’s simple data-driven API, it’s quick and easy to add graph visualizations to your React applications.
Ship custom, high-performance graph visualization to your users, wherever they are.

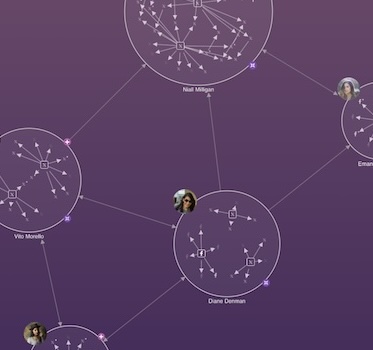
Build interactive graph visualization tools to reveal threats and hidden insight

Integrating ReGraph into our intelligence platform took little effort. The added value of the graph and time bar visualization, on the other hand, is massive. Our customers love the additional possibilities, as they now have new views that improve their decision-making process.
Built for React
For React developers, ReGraph offers a simple and clean coding experience. It has familiar logic, easy state handling and well-documented props.
You can choose where your data is stored, and how the component looks and behaves. It works in any browser, on any device, and integrates readily with any server or database.
It’s a completely flexible way to build a custom React graph visualization application.
Designed for scale
When building a graph visualization application, your technologies shouldn’t hold you back.
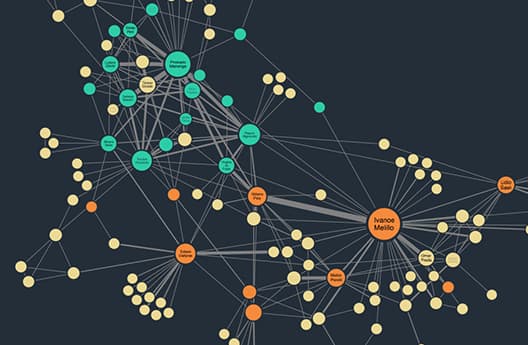
ReGraph is designed for scale: whether you need to explore 10 nodes or 10,000, and whether you have a handful of end-users or hundreds of thousands of customers around the world.
Every part of the toolkit is carefully optimized, and relies on modern web technologies for easy deployment to everyone who needs to use it.
A flexible toolkit
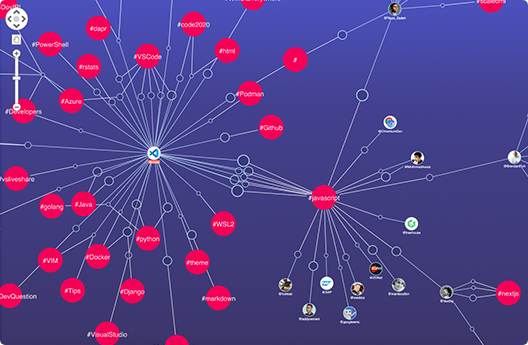
ReGraph is the React graph visualization toolkit that lets you build applications specifically for your users, your data and the questions you need to answer.
It fits with any browser, device, server or database and comes with clear tutorials, demos and API documentation. Combined with our developer support, you’ll be uncovering network insight in no time.


Click a logo to find out more

Support from your first login
Building a graph visualization application can be a complex challenge to navigate without the right support.
Our team is with you every step of the way, from first login to product launch and beyond.
Enjoy on-boarding guidance, project health checks, deep-dive workshops and unparalleled front-line support – all delivered by our team of domain experts.
ReGraph is

Powerful
ReGraph makes it easy to build powerful React graph visualization applications. Everything has been carefully optimized for performance, from its layout algorithms to its supercharged graphics rendering engine.

Scaleable
You’ll want to share your graph visualizations. Modern web technologies power your ReGraph applications, so you can easily roll them into other tools and deploy to anyone, anytime.

Simple
ReGraph comes with tutorials, demos, code examples, a carefully crafted API and a live-coding playground. Combined with our awesome support, you’ll be ready to visualize your graphs in no time.
Want to try it for yourself?
ReGraph’s advanced functionality
Our customers
Since 2011, we’ve helped thousands of developers to build graph visualization applications with our toolkit technology.