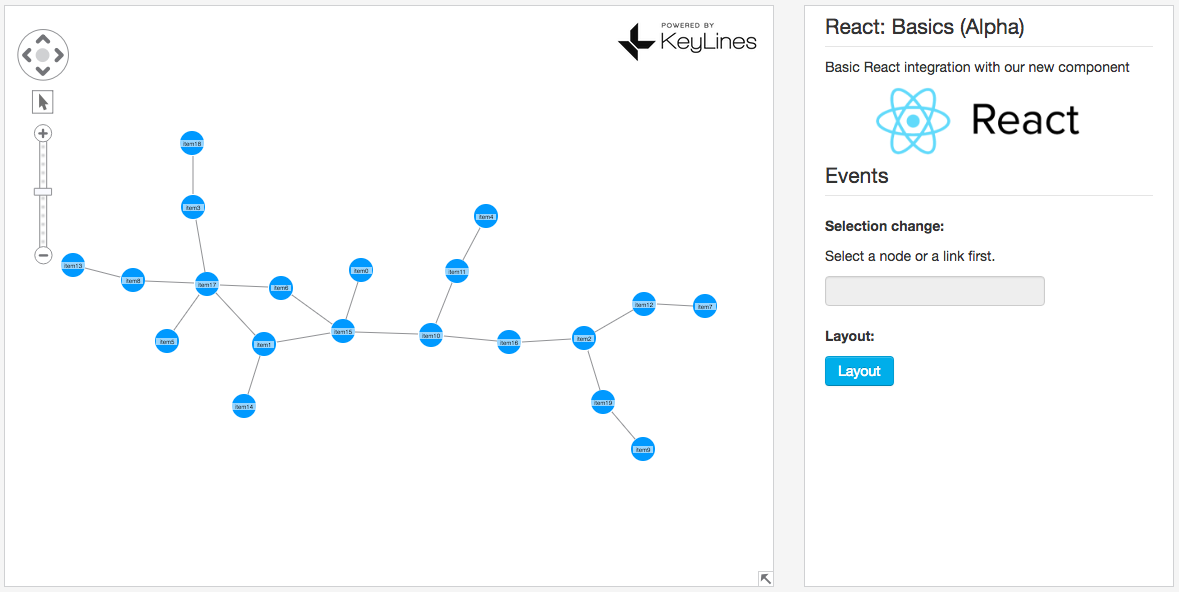
Integrating ReactJS with the KeyLines toolkit
Andrew Disney Marketing Director
8th September, 2016 | 4 min read
If you can’t use ReGraph, our graph visualization toolkit for React developers, find out how to integrate...
Webinar: Building Graph Dashboards
Andrew Disney Marketing Director
30th August, 2016 | 2 min read
Organizations are investing in data infrastructure: building data lakes, collecting logs, data streams – and...
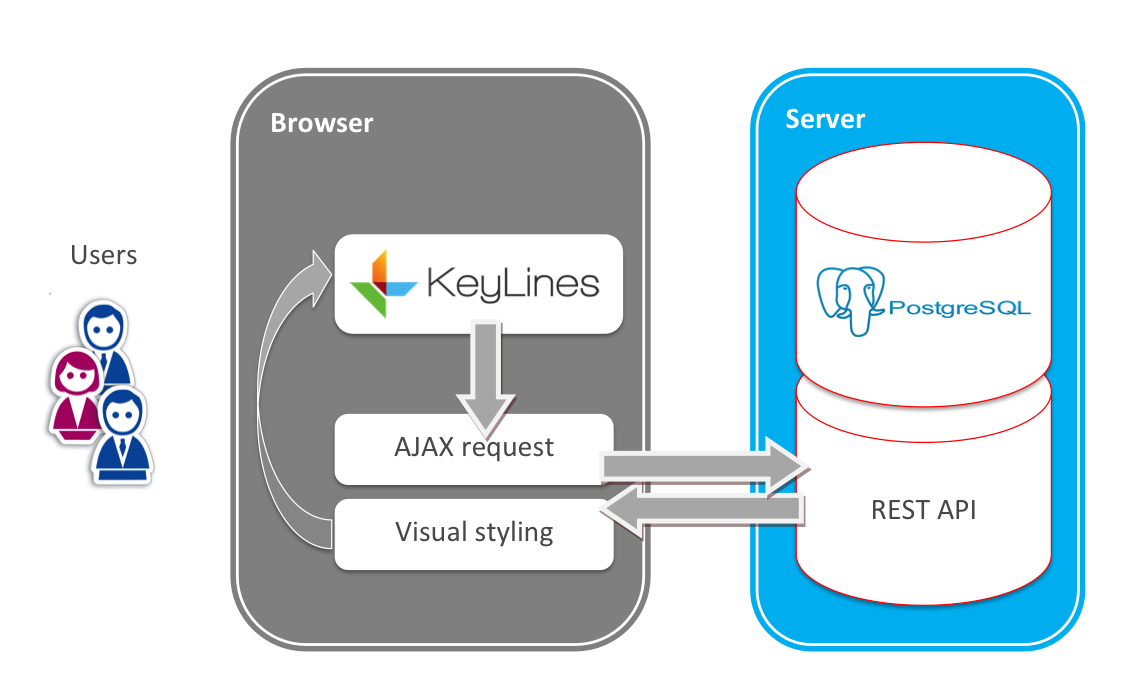
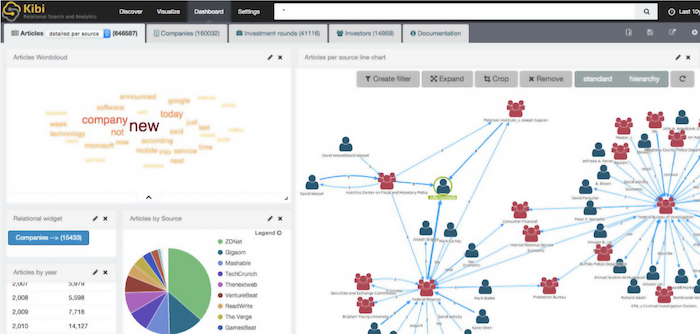
Visualizing relational database using KeyLines
Andrew Disney Marketing Director
23rd August, 2016 | 2 min read
This page is from our blog archive It’s still useful, but check out visualizing relational databases for...
See you at the Data Science Summit!
Andrew Disney Marketing Director
27th June, 2016 | 1 min read
We’re excited to be back in San Francisco next month for the 2016 Data Science Summit. This year’s event...

Cambridge Intelligence celebrates five years
Andrew Disney Marketing Director
23rd May, 2016 | 2 min read
Last week we celebrated our fifth birthday. Year 5 has been a good one here at Cambridge Intelligence. We’ve...

Cambridge Intelligence is a Gartner Cool Vendor
Andrew Disney Marketing Director
10th May, 2016 | 2 min read
Cambridge Intelligence has been designated a Cool Vendor in a new Gartner report for innovative, impactful and...
Visualizing Graphs with WebGL
Andrew Disney Marketing Director
12th April, 2016 | 4 min read
We recently announced the release of KeyLines 3.0 – the third major edition of our network visualization...

Anomaly detection in cyber security visualizations
Andrew Disney Marketing Director
6th April, 2016 | 4 min read
There are lots of ways for a cyber security analyst to look at their data – as tables, bar charts, line...
FAQ: The Lens Layout
Andrew Disney Marketing Director
22nd February, 2016 | 3 min read
Learn all about our lens graph layout, based on the binary stress model of calculating layouts with a circular...