
Memgraph joins our Technology Alliance
Catherine Kearns Content Strategist & Team Lead
26th November, 2018 | 2 min read
We’re pleased to welcome Memgraph, creators of the real-time, web-scale graph database technology, to the...

Cambridge Intelligence joins Scale-Up Club 2018
Catherine Kearns Content Strategist & Team Lead
9th November, 2018 | 2 min read
Cambridge Intelligence, the leading provider of network visualization and analysis solutions, is thrilled to...
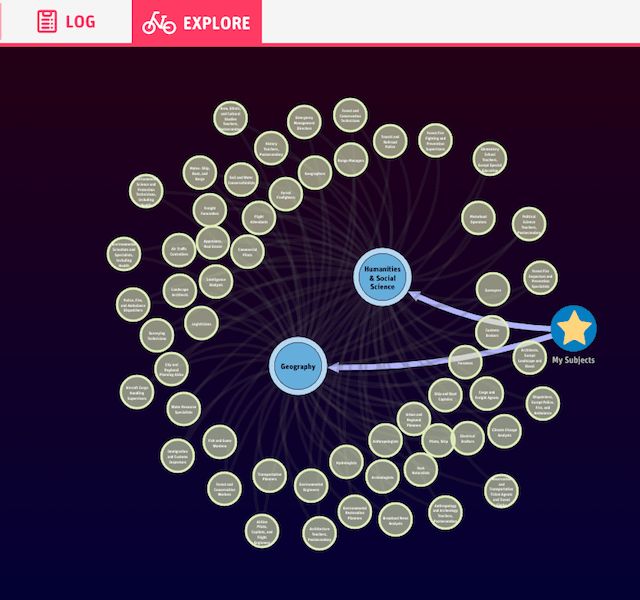
Become Education: a recommendation engine for 21st century careers
Catherine Kearns Content Strategist & Team Lead
8th October, 2018 | 6 min read
In this blog post, we’ll see how Become Education use graph visualization, powered by KeyLines, to equip...

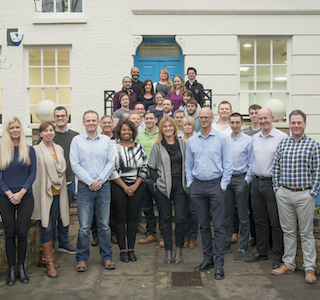
We’ve had a facelift
Catherine Kearns Content Strategist & Team Lead
17th September, 2018 | 4 min read
Thanks to our recent office refurb, our Cambridge HQ now has a stylish interior...
We’ve been shortlisted for The Sunday Times Tech Track
Catherine Kearns Content Strategist & Team Lead
10th September, 2018 | 2 min read
Cambridge Intelligence, the leading provider of network visualization and analysis solutions, has been included in...
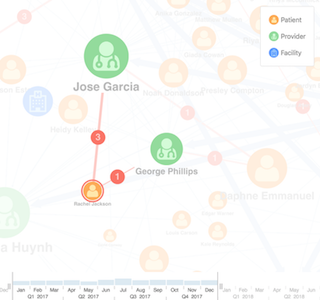
Achieve Customer 360 with graph visualization
Catherine Kearns Content Strategist & Team Lead
15th May, 2018 | 5 min read
We show you how graph visualization can help you achieve Customer 360 – a unified picture of your customers, to...
Graph visualization tools and accessibility
Catherine Kearns Content Strategist & Team Lead
2nd April, 2018 | 6 min read
In this post we give you tips on building a KeyLines app that as many people can benefit from as possible. We also...
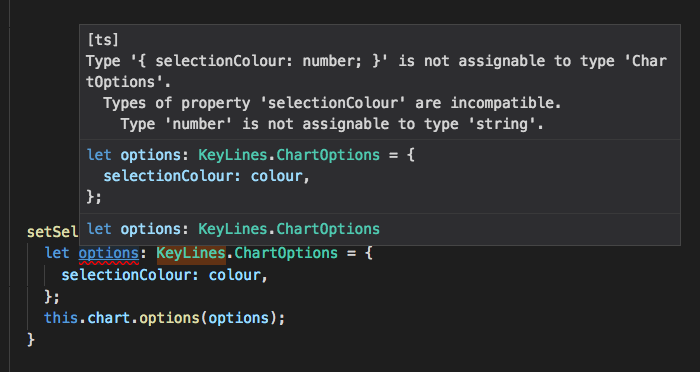
Using TypeScript in KeyLines
Catherine Kearns Content Strategist & Team Lead
28th July, 2017 | 6 min read
Learn how to use TypeScript to write cleaner, faster, safer JavaScript code for your KeyLines graph visualization...