
CDVC going from strength to strength
Dan Williams Head of Product Management
19th November, 2018 | 2 min read
We hosted CDVC events in Tel Aviv and London, bringing together leading graph visualization specialists to share...
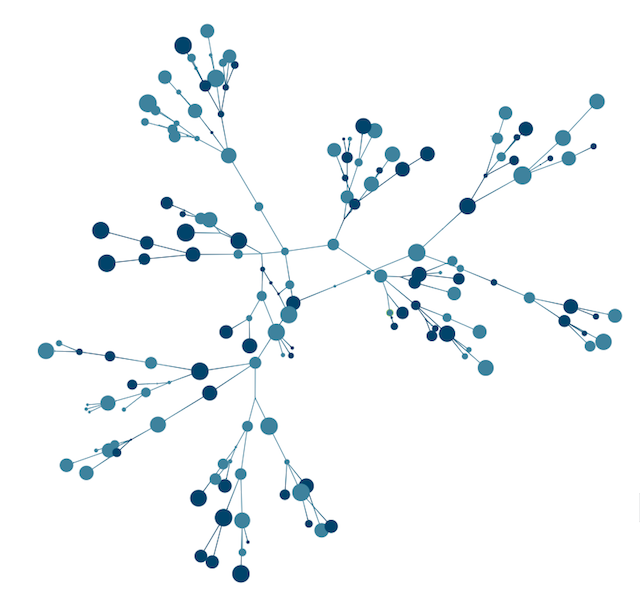
Organic layout for fast & powerful graph visualizations
Dan Williams Head of Product Management
22nd October, 2018 | 4 min read
This blog post takes a closer look at the newest addition to our layouts family. It shows how the organic layout...
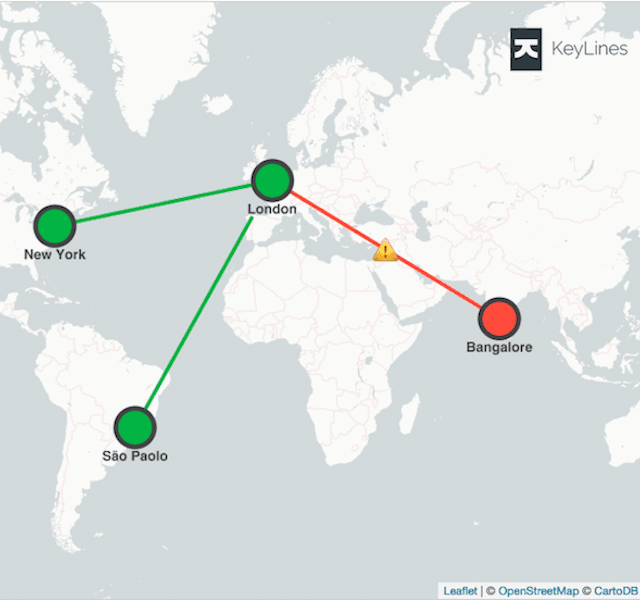
Create a map visualization with Neo4j geospatial data
Dan Williams Head of Product Management
17th October, 2018 | 7 min read
With KeyLines and Neo4j graph database integrations, exploiting geospatial data has never been easier. Discover...
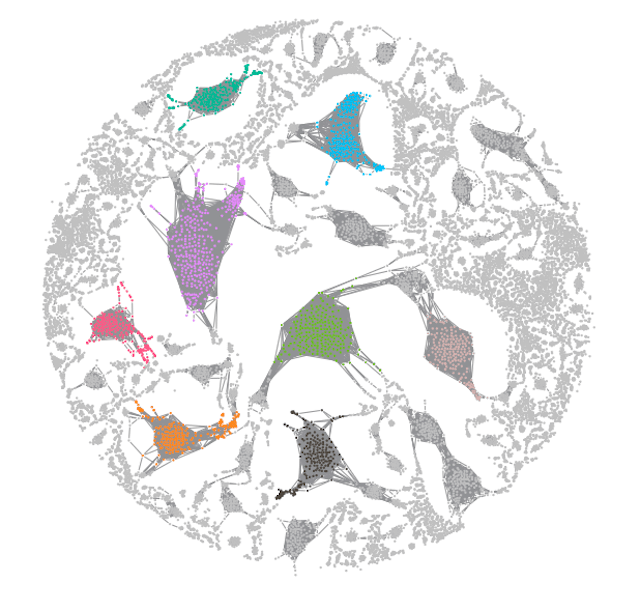
Five steps to tackle big graph data visualization
Dan Williams Head of Product Management
21st September, 2018 | 8 min read
A step-by-step guide to understanding and visualizing very large graph datasets using our ReGraph & KeyLines...

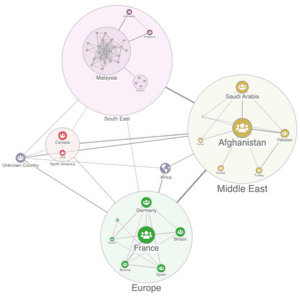
How we predicted the World Cup result
Dan Williams Head of Product Management
18th July, 2018 | 5 min read
We take a closer look at how we used graph theory to predict France as the 2018 FIFA World Cup winners....
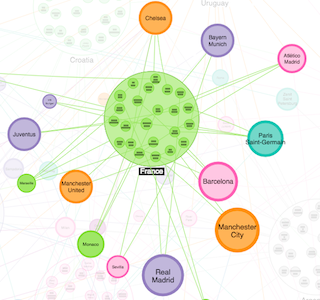
Can graph theory predict the World Cup winner?
Dan Williams Head of Product Management
29th June, 2018 | 4 min read
We hear a lot of success stories about how graph theory can make stunning predictions. In this blog post we test...
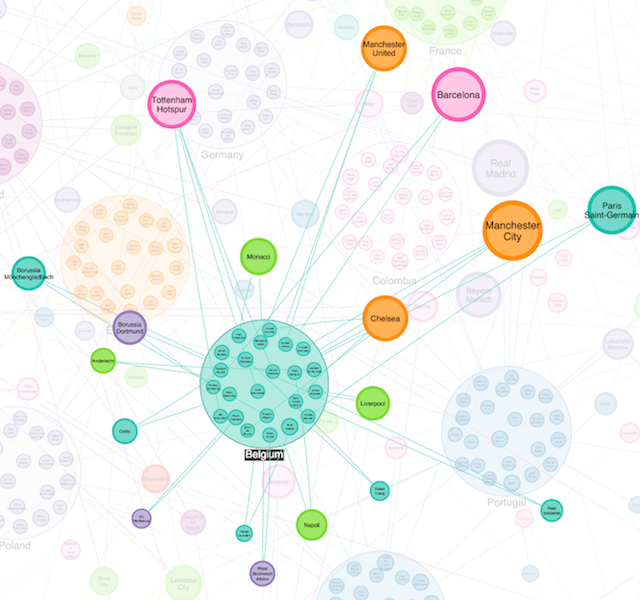
Visualizing the 2018 World Cup
Dan Williams Head of Product Management
25th June, 2018 | 3 min read
With the World Cup in full swing, we thought it would be fun to visualize it using our graph visualization...
Hands-on graph visualization: KeyLines & Neo4j
Dan Williams Head of Product Management
30th May, 2018 | 8 min read
How to use KeyLines’ Cypher integration and quick-start Neo4j demos to build your own powerful Neo4j graph...
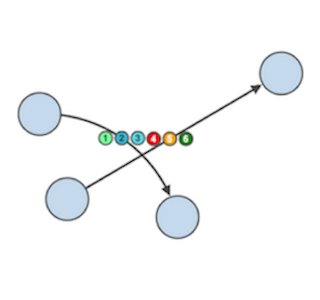
KeyLines 4.3 – glyphs, SVGs & more
Dan Williams Head of Product Management
30th April, 2018 | 2 min read
KeyLines 4.3 enables you to align glyphs with link direction, provides better support for SVGs, has an updated...