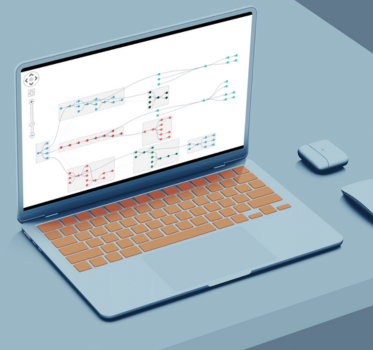
Product update: Smoother and more insightful sequential views
Courtney Collins Product Manager
5th March, 2024 | 2 min read
The latest versions of KeyLines and ReGraph, our graph visualization SDKs, include two hotly-anticipated...
Courtney Collins Product Manager
5th March, 2024 | 2 min read
The latest versions of KeyLines and ReGraph, our graph visualization SDKs, include two hotly-anticipated...
Ivan Krushkov Commercial Development Lead
9th August, 2023 | 8 min read
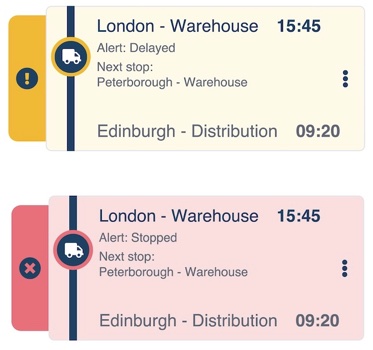
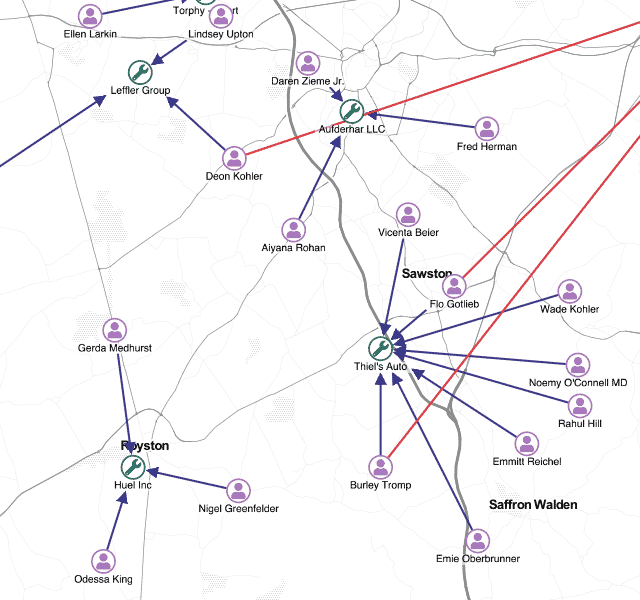
In this post, I show how easy it is to design a visual supply chain that’s customized to your users’ needs,...
Kevin Naughten Product Manager
2nd December, 2022 | 10 min read
Bring the perfect graph visualization design to life: our KeyLines and ReGraph SDKs offer almost infinite...
Christian Miles VP of Sales
22nd June, 2021 | 9 min read
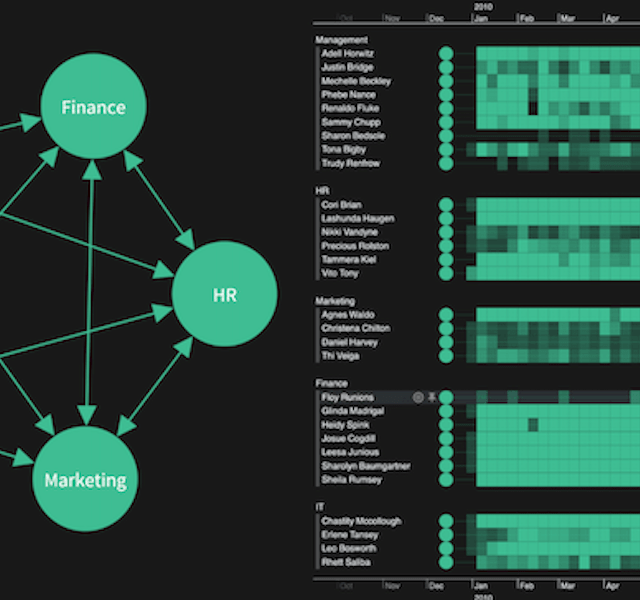
Let’s explore how visual network analysis tools complement dashboards, adding context, interactivity and...
Kevin Naughten Product Manager
15th June, 2021 | 8 min read
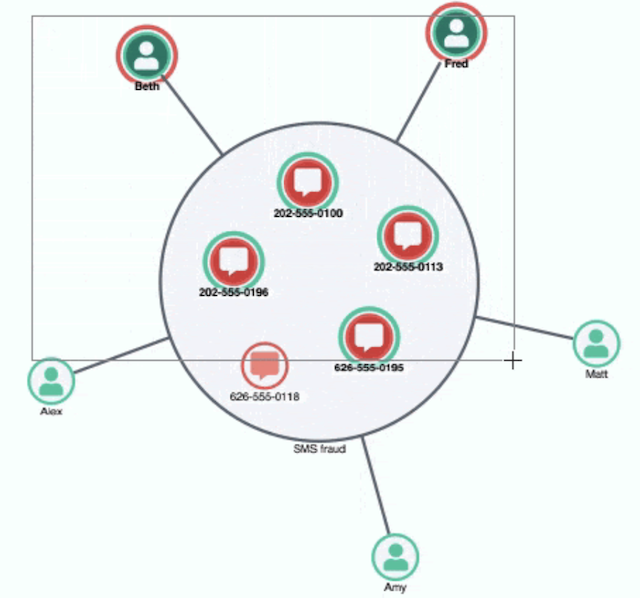
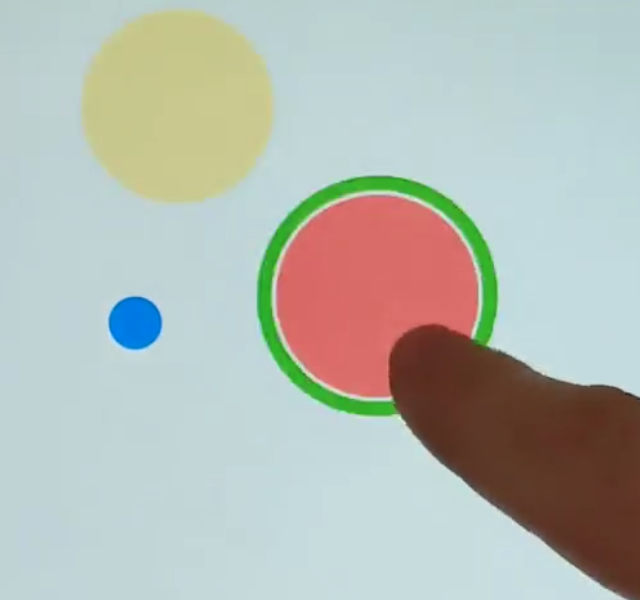
Interactive graph visualization just got easier! These 4 examples show how to customize hover and select behavior...
Andrew Disney Marketing Director
24th November, 2020 | 10 min read
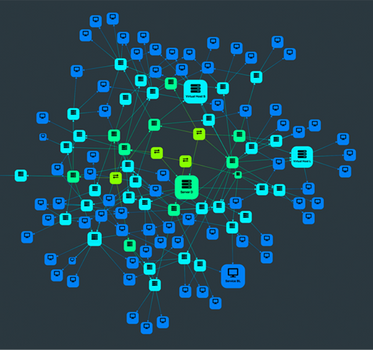
We explore basic color theory, and how carefully-chosen colors can help make your visualizations look good, and...
Dan Williams Head of Product Management
28th July, 2020 | 6 min read
KeyLines 6.0 featured the biggest overhaul of our underlying events engine in the toolkit’s history. Find out...
Kevin Naughten Product Manager
15th July, 2019 | 6 min read
Let’s create visual models that deliver the best user experience (UX). Detailed graph visualizations from an...
Dan Williams Head of Product Management
17th June, 2019 | 5 min read
How to build great graph visualization tools that fit seamlessly inside your existing applications, matching...