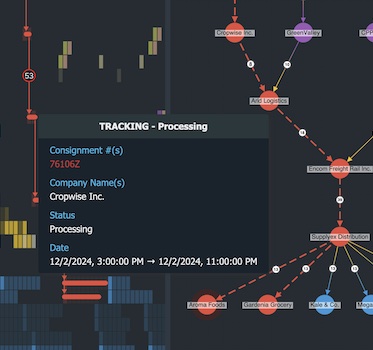
Supply chain network visualization: the spinach story
Bonney O'Hanlon Product Manager
31st January, 2023 | 7 min read
Over recent years we’ve seen more and more businesses digitizing their supply chain processes. Our latest demo...
Bonney O'Hanlon Product Manager
31st January, 2023 | 7 min read
Over recent years we’ve seen more and more businesses digitizing their supply chain processes. Our latest demo...
Corey Lanum Chief Product Evangelist
3rd January, 2023 | 15 min read
Follow this tutorial to build an interactive web application – integrated with Amazon Neptune – to...
Khadeja Sajjad Software Developer
17th August, 2021 | 10 min read
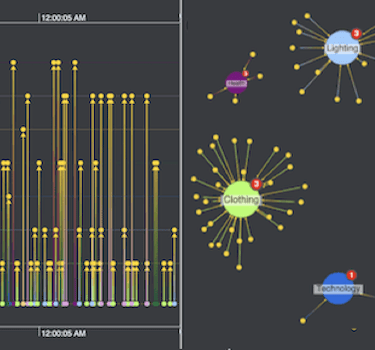
In this post, I’ll aim to spot fake Amazon reviews using the powerful graph and timeline data visualization...
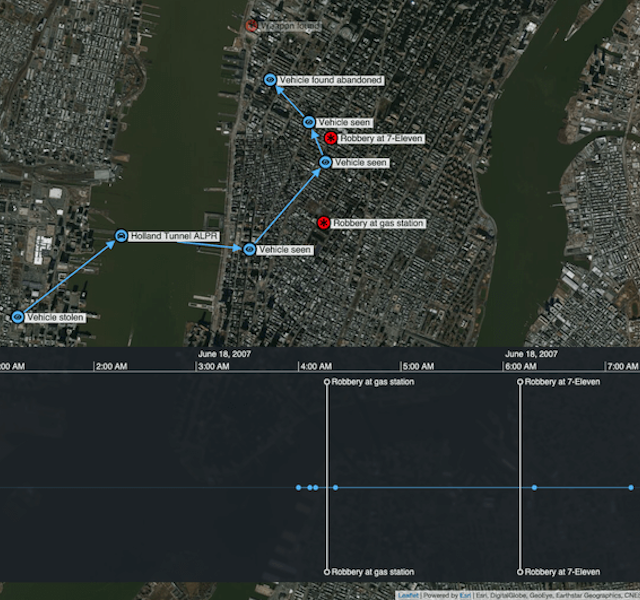
Dan Williams Head of Product Management
27th July, 2021 | 9 min read
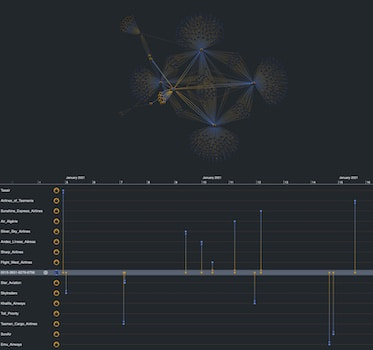
Find out how to use network visualization and forensic timeline analysis to make sense of complex, high-velocity...
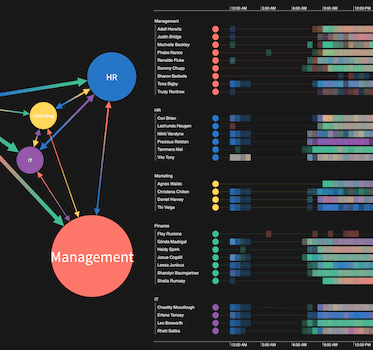
Christian Miles VP of Sales
6th July, 2021 | 8 min read
Let’s make our visual network analysis tool for dashboards even better! In pt2 of this series, we use...
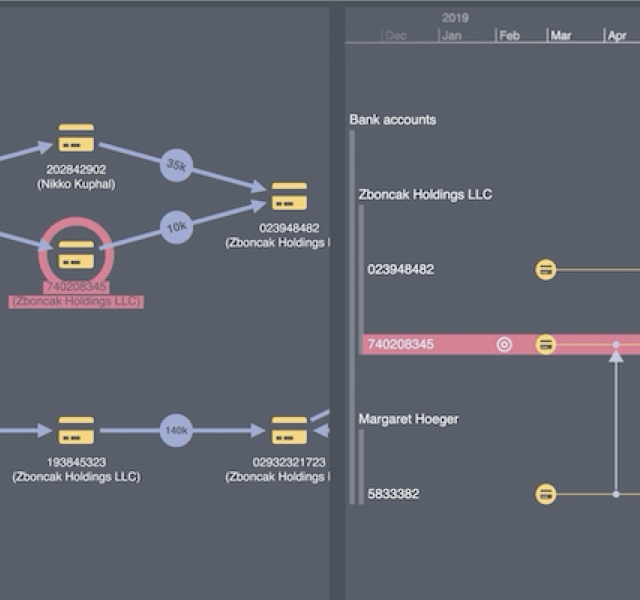
Dan Williams Head of Product Management
1st June, 2021 | 8 min read
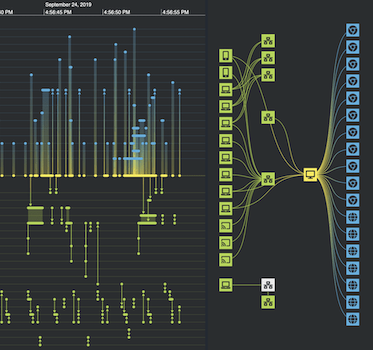
Discover how we use KeyLines & KronoGraph to create flow analysis apps essential for investigating financial...
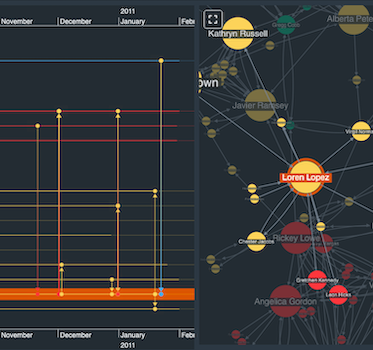
Andrew Disney Marketing Director
23rd February, 2021 | 4 min read
To build a criminal case, investigators collate information from all sources, revealing an accurate and compelling...
Andrew Disney Marketing Director
26th January, 2021 | 7 min read
Watch any good (trashy) police drama and you’ll quickly spot a few cliches. The maverick cop (tough, but with a...
Andrew Disney Marketing Director
21st January, 2021 | 4 min read
We’ve selected some of the more creative ways to visualize evolving connected data. Let’s explore,...