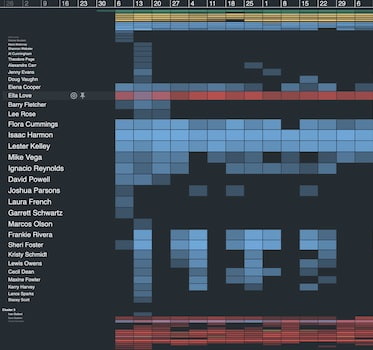
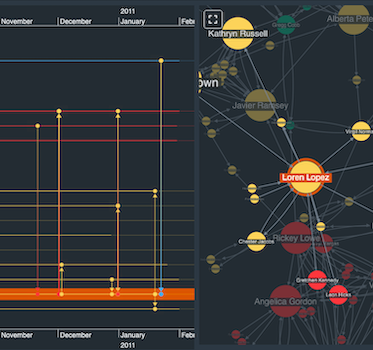
See time-based analysis through a new lens
Catherine Kearns Content Strategist & Team Lead
11th October, 2022 | 7 min read
This post shows how unique navigation features in KronoGraph, our time-based visual analytics SDK, help analysts...
Catherine Kearns Content Strategist & Team Lead
11th October, 2022 | 7 min read
This post shows how unique navigation features in KronoGraph, our time-based visual analytics SDK, help analysts...
Matt Latham Product Manager
4th May, 2022 | 8 min read
Remember the WannaCry ransomware attack? Launched in May 2017, it was one of the most devastating and extensive...
Dan Williams Head of Product Management
1st March, 2022 | 9 min read
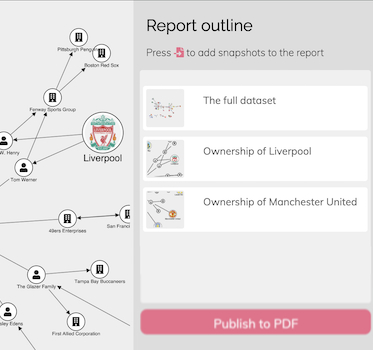
We use our graph visualization toolkits to publish a PDF report based on multiple snapshots of interactive graph...
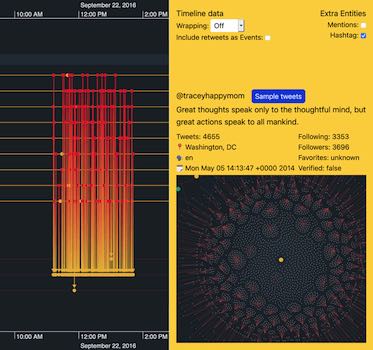
Matt Michel Developer
6th April, 2021 | 8 min read
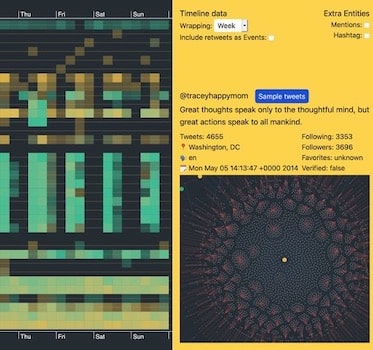
Let’s use KronoGraph and ReGraph to dig deeper into a Twitter data visualization to find patterns of...
Matt Michel Developer
3rd March, 2021 | 8 min read
Create an interactive React application where Neo4j timeline visualization and graph visualization work...
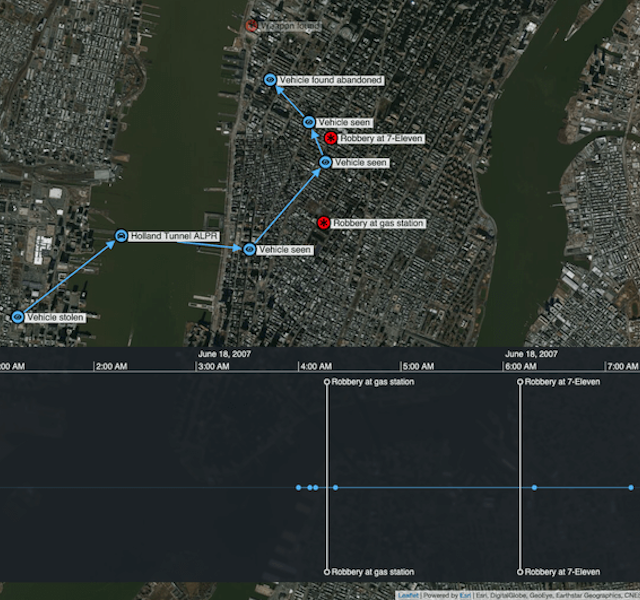
Andrew Disney Marketing Director
23rd February, 2021 | 4 min read
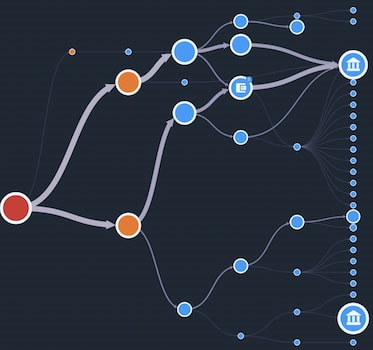
To build a criminal case, investigators collate information from all sources, revealing an accurate and compelling...
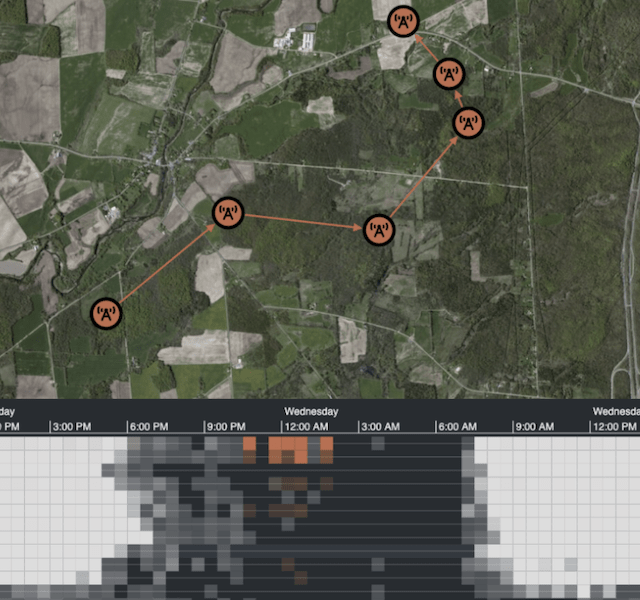
Dan Williams Head of Product Management
3rd February, 2021 | 10 min read
Pattern of life analysis reveals habits and behaviors in big and complex data. See how KronoGraph makes this...
Andrew Disney Marketing Director
26th January, 2021 | 7 min read
Watch any good (trashy) police drama and you’ll quickly spot a few cliches. The maverick cop (tough, but with a...
Andrew Disney Marketing Director
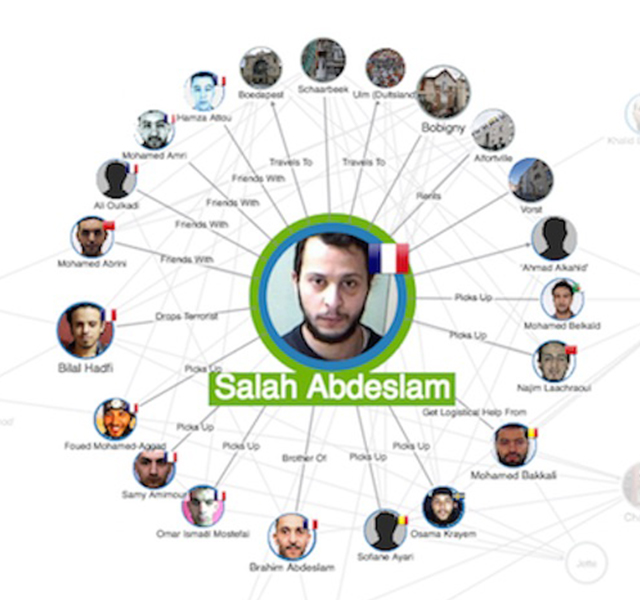
12th September, 2017 | 6 min read
In the first of three blog posts, we explore the real world applications for graph visualization starting with law...