Each year, an estimated $2.5 trillion is lost through fraud worldwide. Investigators and fraudsters are locked in a secret arms race to develop increasingly sophisticated tools and methods to outwit the other. With every new and costly technique that comes around – chip and pin payments, device fingerprinting, even telephone lie detectors – fraudsters inevitably find a way to get past them.
But we want to show you how network visualization could be a huge leap forward in the fight against fraud, combining the power of computers with the intelligence of humans to add a whole new dimension to fraud detection.
The ultimate guide to fraud management
How our products power effective fraud detection
The fraud balancing act
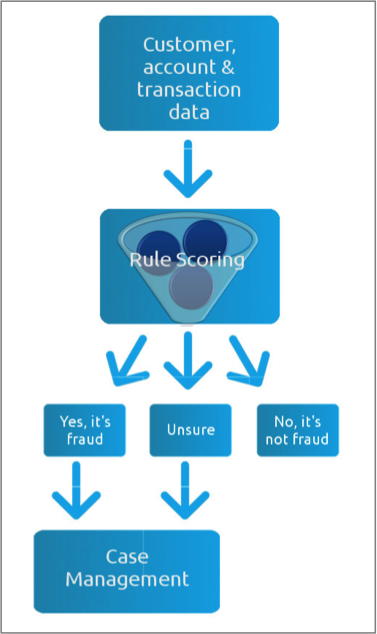
Existing fraud detection systems all basically work in the same way: huge volumes of data are collated, rule-scored and sorted into three piles: fraud, not fraud and unsure. In one insurance company we spoke to, those ‘unsures’ represented 2% of all claims made. It doesn’t sound like a big number, but it’s enough to make the manual review the most costly and time-consuming part of fraud detection. For some, that 2% may also represent the difference between making a profit and suffering a loss. The manual review is clearly a weak point for many companies fighting fraud; a careful balancing act between keeping genuine customers happy with fast, accurate decisions and preventing real frauds from getting through.
The fraudsters’ advantage
The problem is that fraudsters understand how these systems work, and they know how to exploit their inherent weaknesses. Organized criminals are experts at creating complex audit trails that data mining alone cannot detect. This, in turn, forces investigators to collect bigger and bigger mountains of data from every possible source – some accurate, some false, some intentionally misleading. With a broader dataset come more opportunities to find fraud amongst the false alarms, but without an efficient way to manage this data, an investigator faces an impossible task.
Visualizing Fraud: Uncover the relationships, uncover the fraud
Whether it’s a case of identity theft, account takeover or a false insurance claim, virtually all instances of fraud involve the fabrication of a relationship between people or entities. By modeling data in a way that highlights these relationships, investigators are able to highlight suspicious and fraudulent behavior.
Uncovering fraud with visualization
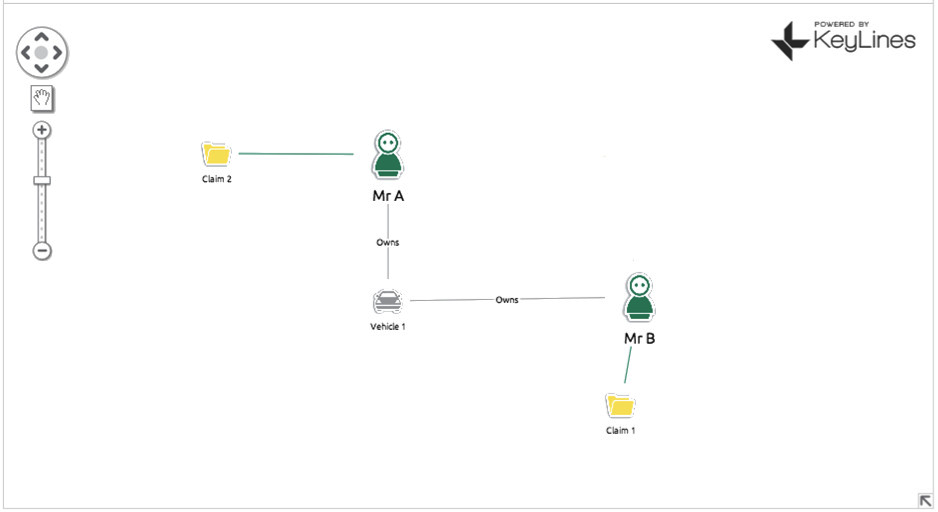
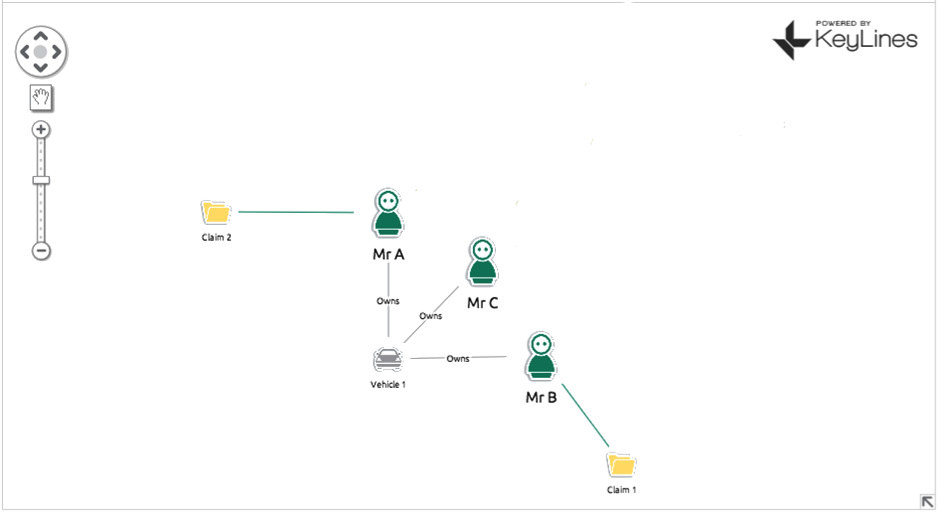
For an example, let’s consider an auto insurance claim… Mr B makes a claim on his insurance policy, saying someone drove into his car (Vehicle 1) at a traffic light. Your automated review process flags this as suspicious as Vehicle 1 was in an accident a few years back with Mr A, who also made a claim. An insurance fraud investigator looks at the claim and decides it’s legitimate. They’re two separate accidents in two separate locations involving two separate people. It’s just an unlucky car. What he misses completely is that Vehicle 1 is not only linked to Mr A and Mr B, but ALSO Mr C. Mr C and Mr B both live at 232 Main Street. Mr A and Mr B both make monthly insurance payments from the same bank account. Chances are Mr A, B and C are either all the same person OR three people working in cahoots. Also implicated is another car, Vehicle 2, which is registered to Mr C, who has been using it to make other fraudulent claims.
Confused?
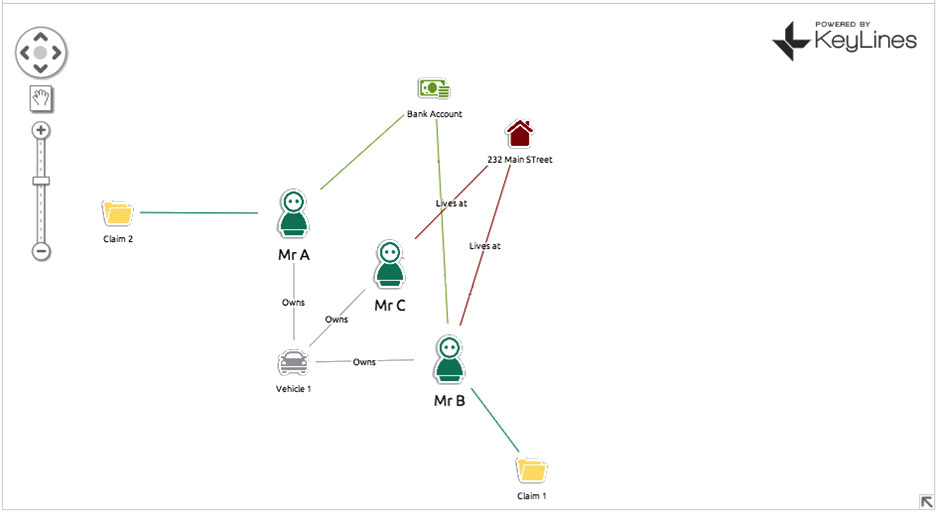
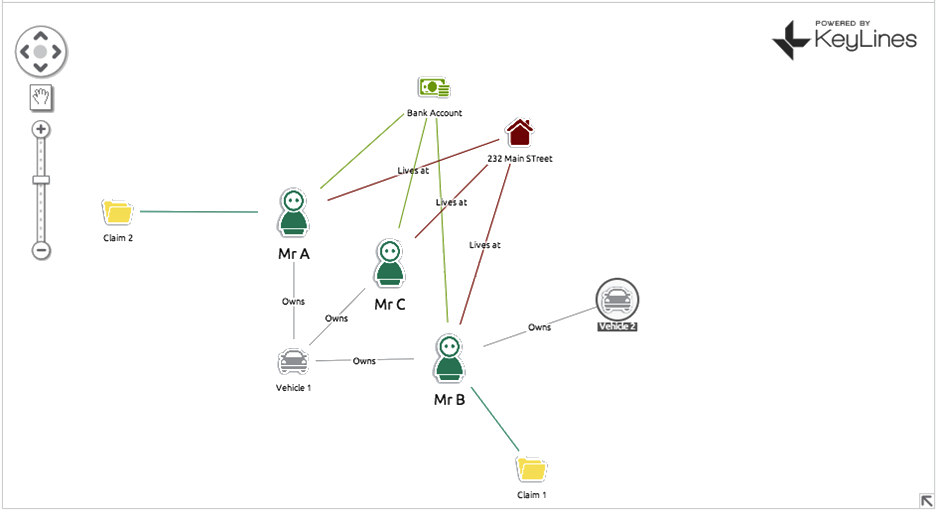
With a simple (and this is simple – we can expand into hundreds of nodes) we have managed to uncover three fraudulent insurance policies plus a vehicle that is most likely also involved in fraud.
The power of network visualization
It’s been proven that humans are able to interpret shapes and layouts more effectively than text or data. Integrating software like KeyLines into a case management system allows investigators to exploit their innate abilities and build a process that’s more fit for the task in hand, KeyLines can add a whole new dimension to fraud detection. Instead of just checking for anomalies in expected patterns, or finding correlations in transaction characteristics, KeyLines links disparate pieces of data that might be four, five or six hops away from each other. Previously hidden or assumed irrelevant connections become new lines of inquiry and detection becomes faster and more effective. If you would like to know more about integrating KeyLines with your fraud management systems, get in touch for a demonstration or further information.


