What is a graph database?
A graph database is a kind of database that represents data as a graph or network using nodes, edges and properties.
Fitting huge amounts of connected data into a database not optimized for that purpose is a real challenge, with developers usually resorting to a relational database and joining tables, or a NoSQL database and set of foreign keys.
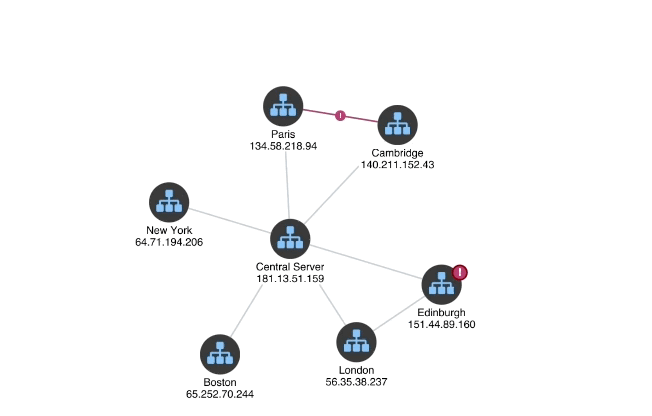
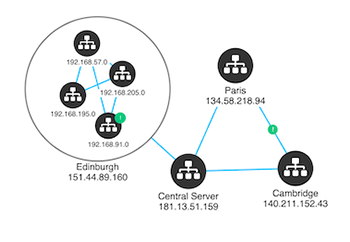
A graph database circumvents this complexity by representing data in graph format – i.e. as a collection of objects and their relationships. The objects are usually called nodes; the links are often called edges.
Our ultimate guide to graph database visualization covers everything you need to start building effective graph visualizations that’ll help your users find insight in connected data fast.
Why use a graph database?

Graph databases are often touted as the best option for storing connected data. Frequently cited reasons include:
Greater performance – compared to NoSQL stores or relational databases. Graph databases avoid expensive ‘join’ operations and give faster access to connected data.
Lower latency – as the nodes and links in a graph database ‘point’ to one another, millions of related records can be traversed with a constant response time irrespective of database size.
Whiteboard friendliness – the graph format probably closely resembles your real-world data, meaning you can avoid complex data mapping and modeling exercises.
Good for semi-structured data – graph databases are schema-free, meaning patchy data, data with exceptional attributes, or data whose structure may change, can be more readily accommodated.
Why visualize your graph data?
KeyLines is a database agnostic graph visualization technology. It works with data from any source: graph database, NoSQL data stores, triple stores, and SQL databases or even just from memory. That said, graph databases are a particularly good fit for KeyLines:

Convenient data structure
By storing data in a graph format, graph databases greatly simplify the data mapping and visualization modelling process. If you’re attempting to visualize data using a flat or tabular data source, you might find our blog post Graph data modelling 101 useful.

Speed
KeyLines is a fast and powerful graph visualization engine. Pairing it with a graph database – which is optimized for deep, complex graph querying – amplifies that performance. With an interactive KeyLines interface, users can ‘walk the graph’, exploring graphs quickly and effectively.

Deeper insight
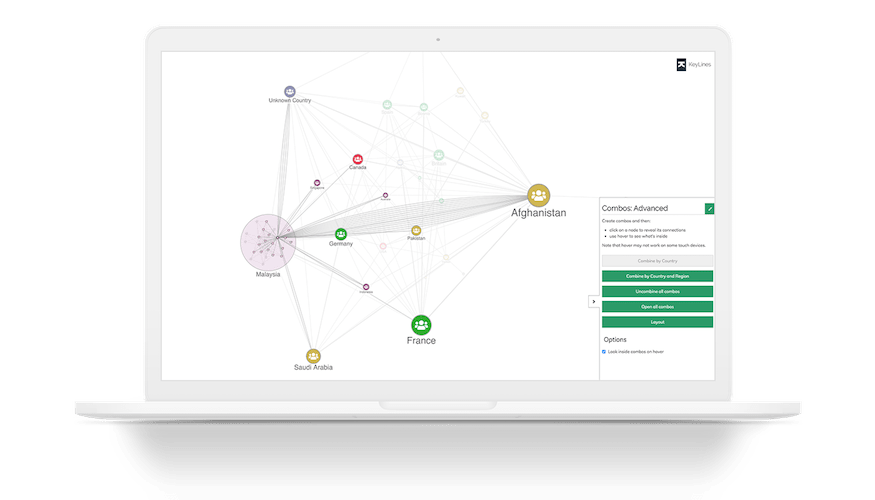
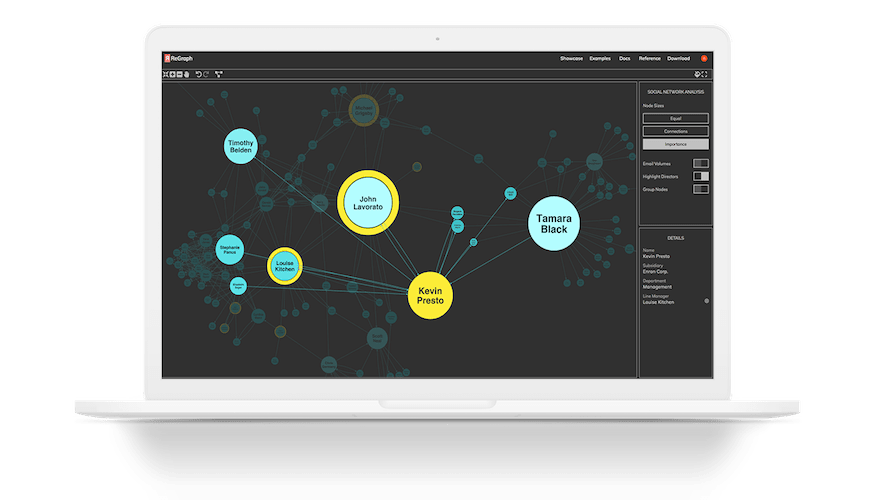
Graph data is inherently visual. Giving users a visual way to interact with graph data leads to deeper understanding and faster decisions. Graph visualization techniques provide powerful tools to uncover patterns and detangle critical insight.
Ready to learn more?
Our white papers introduce graph visualization topics, from use cases to specific techniques.
Visualize your graph database
Our graph visualization SDKs offer integrate seamlessly with any datastore, including all of the most popular graph databases.
Click on a logo to learn more.


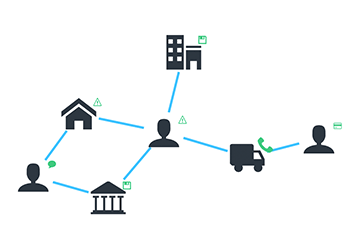
Who needs to visualize graphs?
Connected data is all around us. We help organizations solve their biggest challenges.
Law enforcement & security
Join the dots between people, places and events and filter out the noise that stops you seeing the connections and preventing crime.
Infrastructure management
Create interactive visualizations that reveal bottlenecks and vulnerabilities in connected critical infrastructure.
Anti-fraud
Uncover unusual activities to identify, predict and prevent all kinds of fraud: from insurance scams to VAT fraud.
Cyber security
Make sense of vast, complex and densely-connected data to uncover cyber security threats and help keep networks secure.
Interested in learning more about the real-world uses of graph visualization?
How to visualize your graph data
At Cambridge Intelligence, we help developers build graph visualization tools that are 100% customized to their users, their data and the questions they need to answer.
Graph visualization for JavaScript developers
Code how you like. Add graph visualizations to your applications that work anywhere, as part of any stack.
Graph visualization for React developers
With ReGraph’s simple data-driven API, it’s quick and easy to add graph visualizations to your React applications.