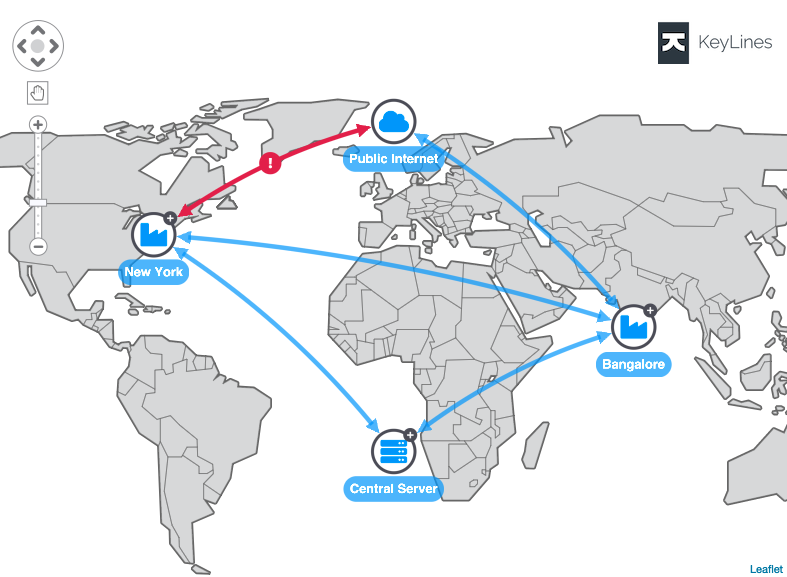
KeyLines 5.0: Magnificent map mode & more
Dan Williams Head of Product Management
20th November, 2018 | 2 min read
We’re excited to announce the release of KeyLines 5.0: the next generation in visualizing connections in...
Dan Williams Head of Product Management
20th November, 2018 | 2 min read
We’re excited to announce the release of KeyLines 5.0: the next generation in visualizing connections in...

Dan Williams Head of Product Management
19th November, 2018 | 2 min read
We hosted CDVC events in Tel Aviv and London, bringing together leading graph visualization specialists to share...
Federico Bozzini Intern - Sales Engineering
13th November, 2018 | 6 min read
We use the advanced features of our graph visualization technology to test the friendship paradox. We’ll show...

Catherine Kearns Content Strategist & Team Lead
9th November, 2018 | 2 min read
Cambridge Intelligence, the leading provider of network visualization and analysis solutions, is thrilled to...

Sam Mabaso Marketing Manager
5th November, 2018 | 2 min read
Every month our social committee plans an activity for the team. For our last two events, we visited the Fudge...

Christian Miles VP of Sales
29th October, 2018 | 10 min read
Discover 5 UX tips for building beautiful, useful and intuitive graph and timeline visualizations for both network...
Dan Williams Head of Product Management
22nd October, 2018 | 4 min read
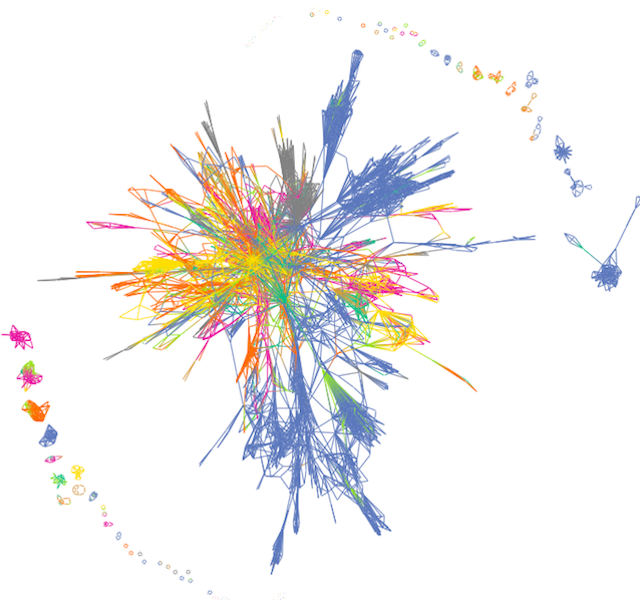
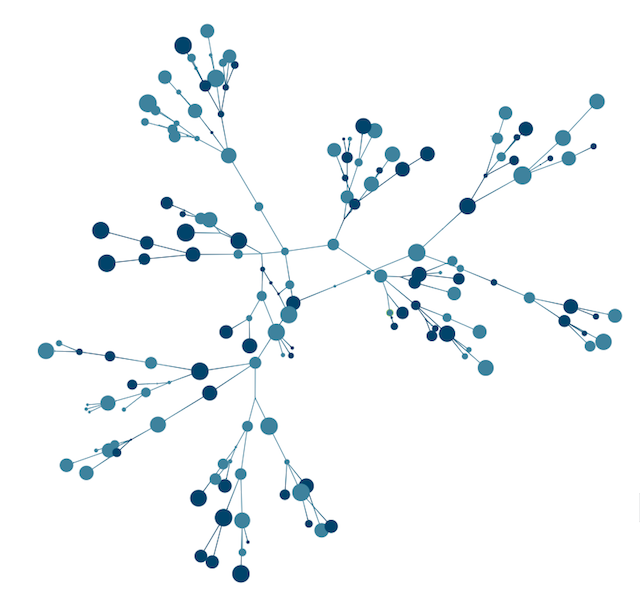
This blog post takes a closer look at the newest addition to our layouts family. It shows how the organic layout...
Dan Williams Head of Product Management
17th October, 2018 | 7 min read
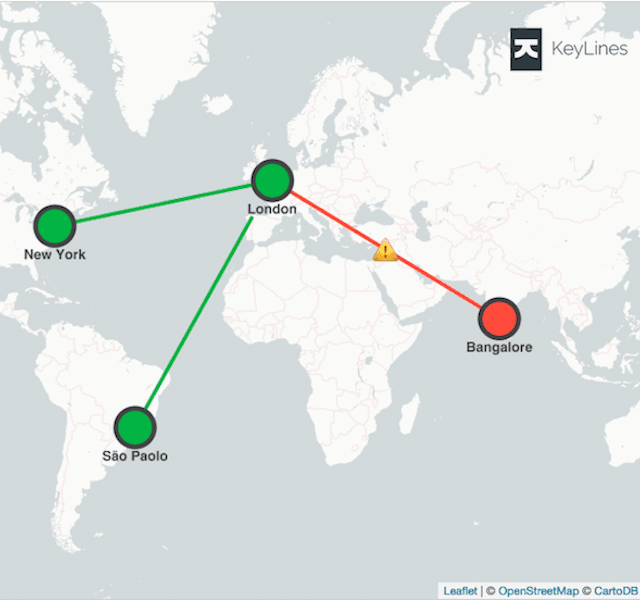
With KeyLines and Neo4j graph database integrations, exploiting geospatial data has never been easier. Discover...
Catherine Kearns Content Strategist & Team Lead
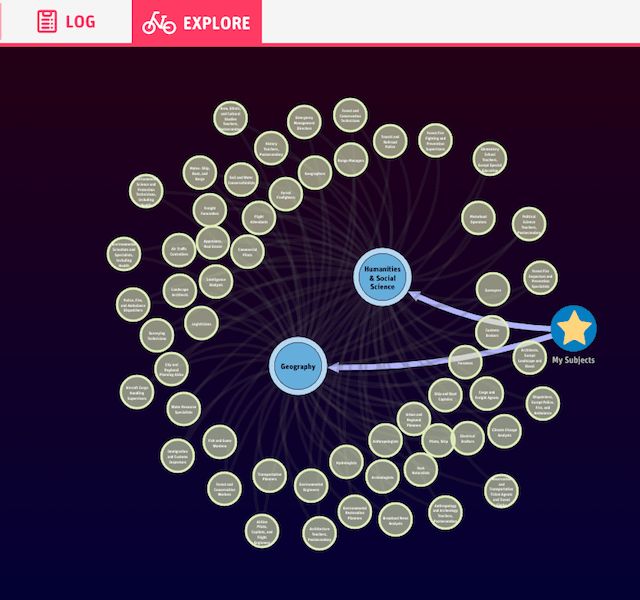
8th October, 2018 | 6 min read
In this blog post, we’ll see how Become Education use graph visualization, powered by KeyLines, to equip...