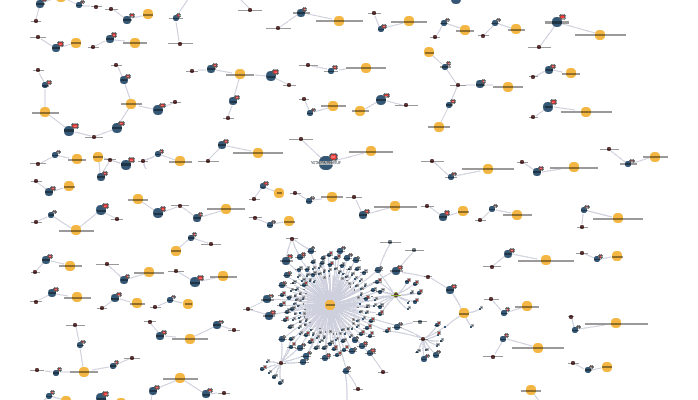
Visualizing restricted substances for REACH compliance
Dan Williams Head of Product Management
13th June, 2017 | 6 min read
Using connected data visualization techniques to manage supply chain risk, ensure restricted substance compliance...
Dan Williams Head of Product Management
13th June, 2017 | 6 min read
Using connected data visualization techniques to manage supply chain risk, ensure restricted substance compliance...
Christian Miles VP of Sales
7th June, 2017 | 6 min read
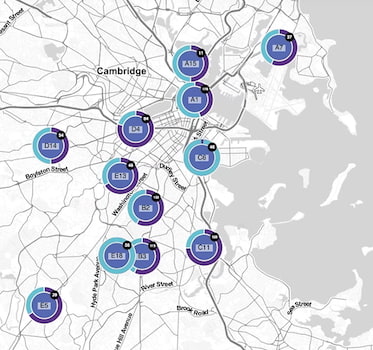
We take a Neo4j graph database of real-life crime incidents in Boston and apply graph visualization techniques to...
Andrew Disney Marketing Director
23rd May, 2017 | 6 min read
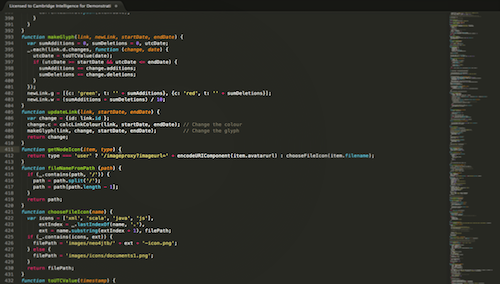
Our favorite bits of the SDK that don’t get enough attention The KeyLines software development kit (SDK) is a...
Andrew Disney Marketing Director
12th May, 2017 | 5 min read
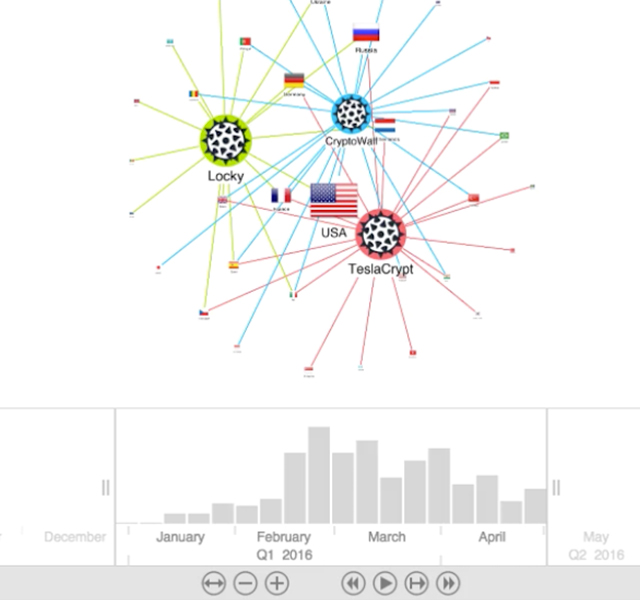
This post explores how KeyLines graph visualization simplifies complex Malware networks, making post-attack...
Dan Williams Head of Product Management
8th May, 2017 | 5 min read
How to get started with KeyLines and Angular. Build your own advanced graph visualization app using the KeyLines...
Stephen Hughes Development Manager
11th April, 2017 | 3 min read
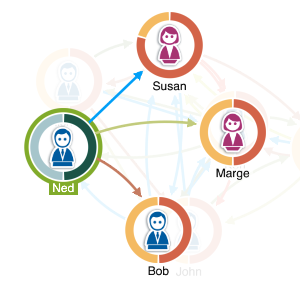
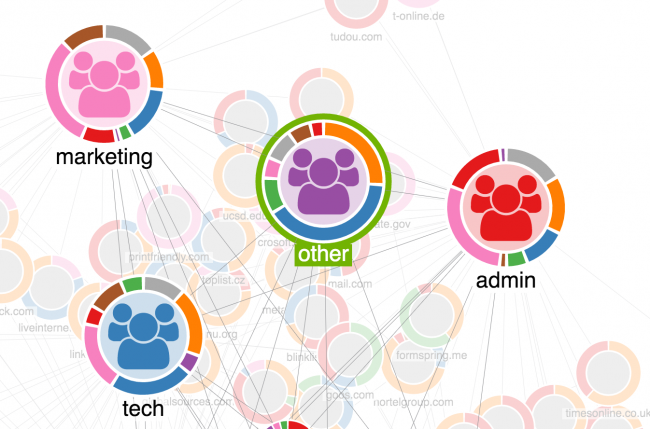
Here are top tips on when to use our donuts feature. They’ll help make your graph visualization apps as...
Stephen Hughes Development Manager
4th April, 2017 | 3 min read
We’re excited to announce KeyLines 3.4 – the latest version of our network visualization toolkit. It...
Andrew Disney Marketing Director
14th March, 2017 | 2 min read
The power of the graph data model lies in its simplicity. Using only nodes, links and properties, it’s possible...
Andrew Disney Marketing Director
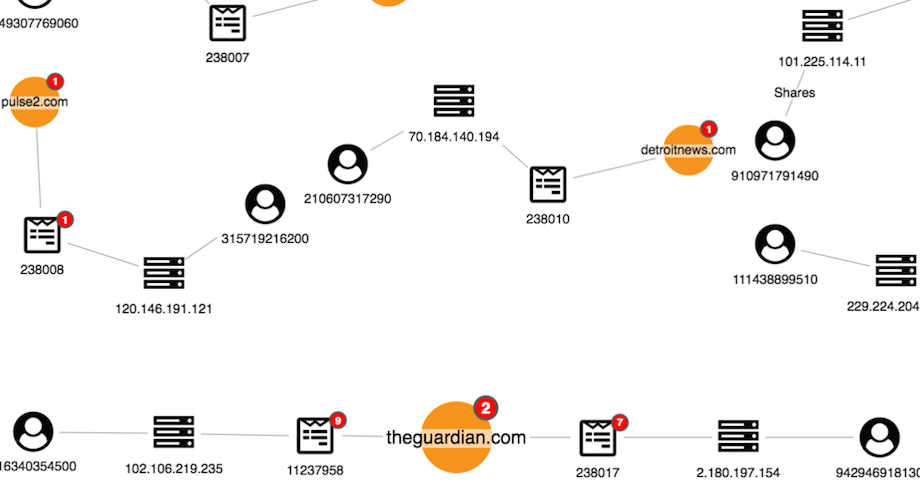
28th February, 2017 | 8 min read
Fake news is nothing new – bad journalism and propaganda have always existed – but recent concerns about its...