Sometimes, the smallest changes in your data can unlock the big picture you need to understand.
In ReGraph 2.0, the latest major version of our graph visualization toolkit for React developers, we’ve made it easier to keep track of your data by using subtle adjustments when the network changes. Your users will appreciate how layouts now adapt intuitively to changes in the chart without triggering a full-blown automatic layout every time.
This release also features a showcase demo based on mafia data we’re using for the first time, improvements to the way items fit into your application’s chart space, and much more.
Adaptive layouts: subtle & effective
When analysts work with visualized data, they create their own mental map of where items exist on the screen. The bigger the network, the more complex that mental map is.
As they focus on items of interest, users often bring in related connected data from the backend, or remove irrelevant nodes. But they don’t always want their changes to trigger a full automatic layout that’ll redraw the network and destroy their mental map.
Here’s where adaptive layouts come in. By adapting organically to the changes around them, components adjust with minimal movements. Items remain in the areas of the chart that the users expect them to be.
Have you tried ReGraph?
It’s our graph visualization SDK for React developers
Mafia Networks showcase demo
The latest addition to the suite of ReGraph showcase demos is an interactive network of communication channels between two real-world Sicilian mafia gangs.
Criminal mafia families are typically highly organized and fiercely loyal, making them hard to infiltrate and disrupt. We’ve sized nodes by degree centrality to show how well-connected individuals are, and customized links so they’re weighted by the volume of communication they’re involved in.
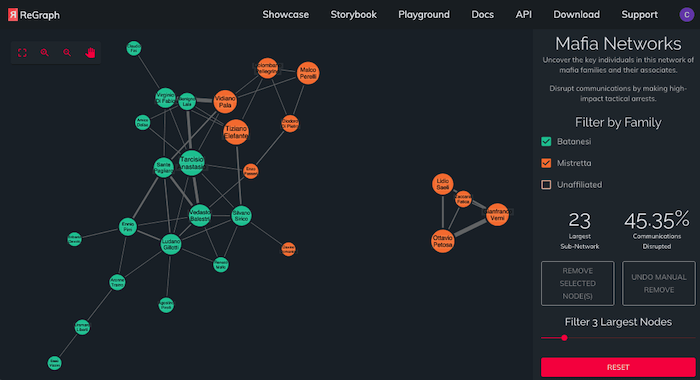
The demo provides answers to key questions on impact analysis – who are the key players? Which individuals should we arrest to cause maximum disruption to the network? How can we stop the families working together?
It’s easy to see the impact removing individuals has on the network. After every change, ReGraph automatically applies an adaptive layout.
Automatic viewport option
By popular demand, there’s a new API option to automatically control how your chart fits items into the viewport. This makes sure users get to see every component in their chart without the need for manual adjustments.
You can also customize the color of the overview window – that useful thumbnail image that helps users keep track of which part of the chart they’re analyzing – so it matches the style of your graph visualization app.
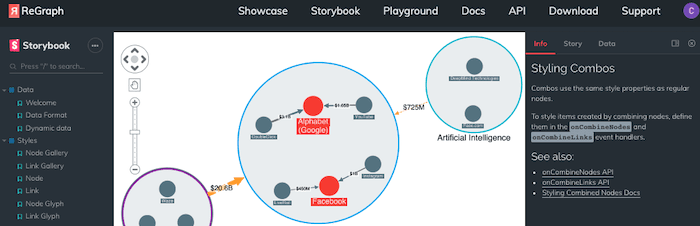
Useful info on ReGraph stories
Every entry in the ReGraph SDK’s Storybook now features an info panel, providing context to what you can see in the example, tips & tricks on how to use each function, and a handy list of related resources.
More control over sequential layouts
Users can now determine precisely how hierarchies should look with the ability to add spacing between tiers of sequential data.
Take a look at ReGraph 2.0
Alongside other improvements and enhancements to the latest toolkit, we’ve created a detailed migration guide to make sure your upgrade from ReGraph 1.0 goes without a hitch.
Not tried ReGraph before? It’s the React graph visualization toolkit your developers will love and your users will thank you for. Register for a free evaluation of ReGraph 2.0


