Astronomical insights with Neo4j and KronoGraph
Corey Lanum Chief Product Evangelist
14th November, 2023 | 15 min read
In this tutorial, you’ll find out how to use Neo4j and KronoGraph to create an interactive timeline...
Corey Lanum Chief Product Evangelist
14th November, 2023 | 15 min read
In this tutorial, you’ll find out how to use Neo4j and KronoGraph to create an interactive timeline...
Christian Lentfort Developer
14th February, 2023 | 11 min read
In this Puppeteer tutorial, developer Christian Lentfort shows you how to create a simple server application using...
Christian Lentfort Developer
9th November, 2021 | 12 min read
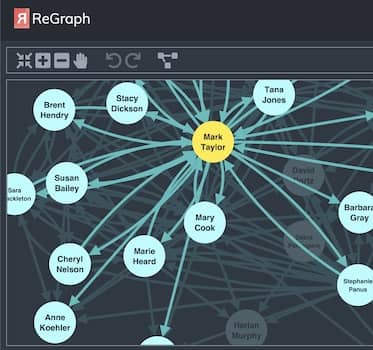
In this Tailwind CSS tutorial, we’ll show you how to customize your ReGraph app and achieve the designs you want...
Christian Miles VP of Sales
22nd October, 2021 | 11 min read
Discover practical tips for developers using ReGraph, our graph visualization SDK for React, on how to avoid...
Dan Williams Head of Product Management
28th July, 2020 | 6 min read
KeyLines 6.0 featured the biggest overhaul of our underlying events engine in the toolkit’s history. Find out...
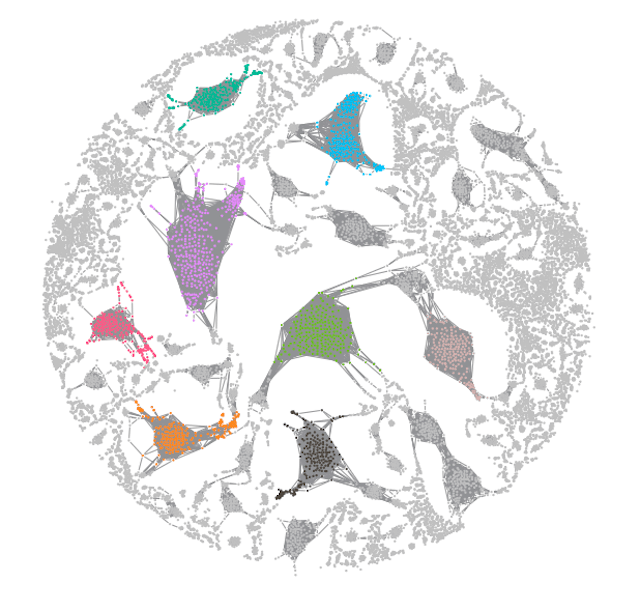
Dan Williams Head of Product Management
21st September, 2018 | 8 min read
A step-by-step guide to understanding and visualizing very large graph datasets using our ReGraph & KeyLines...
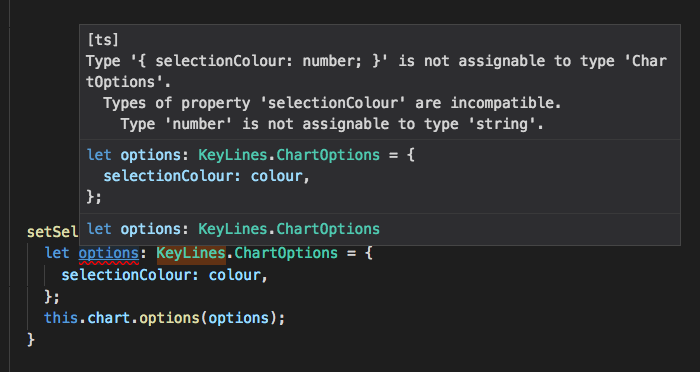
Catherine Kearns Content Strategist & Team Lead
28th July, 2017 | 6 min read
Learn how to use TypeScript to write cleaner, faster, safer JavaScript code for your KeyLines graph visualization...
Stephen Hughes Development Manager
11th April, 2017 | 3 min read
Here are top tips on when to use our donuts feature. They’ll help make your graph visualization apps as...
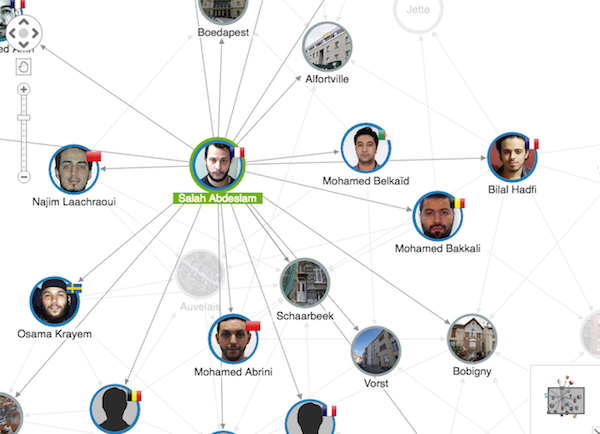
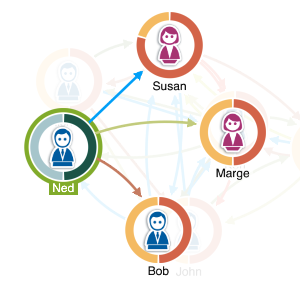
Christian Miles VP of Sales
12th January, 2017 | 5 min read
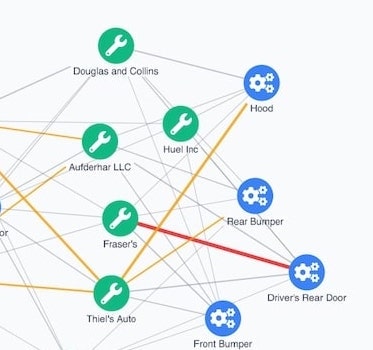
We give tips on getting started with a new graph dataset by visualizing the terrorist network surrounding suspects...