What is link analysis?
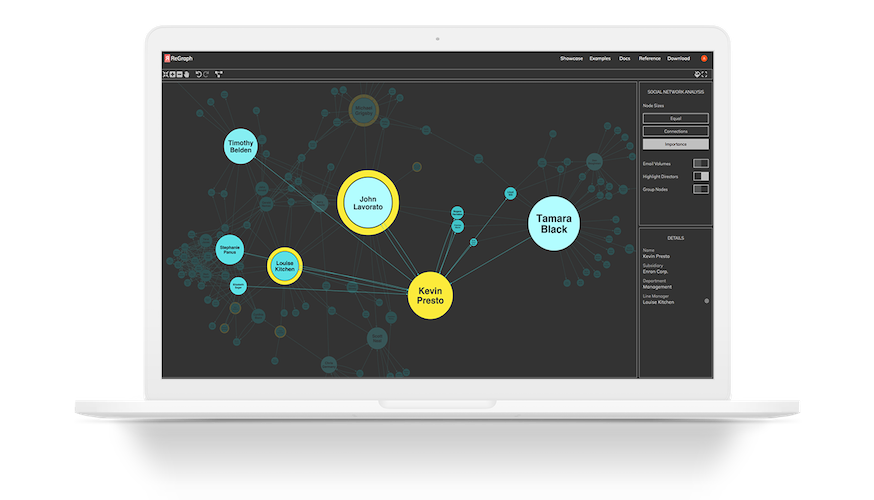
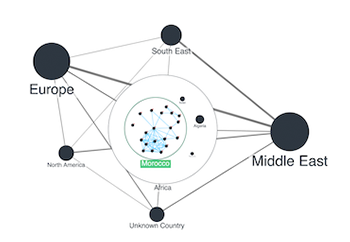
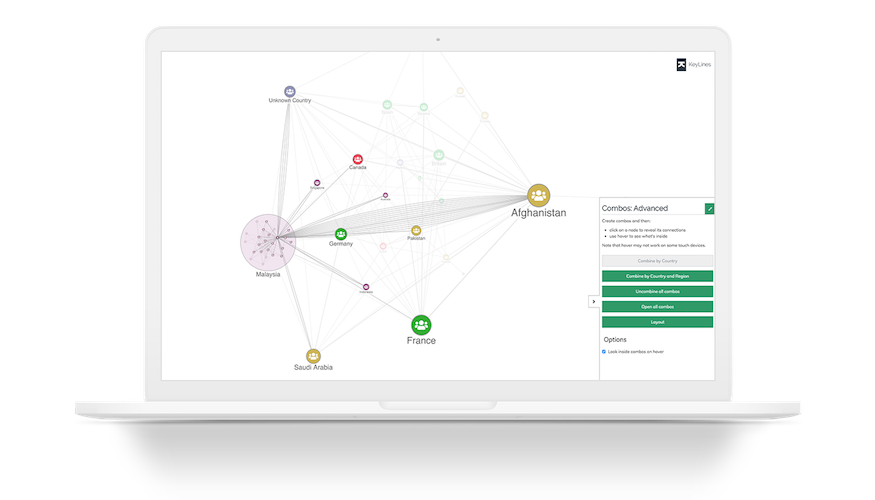
Link analysis, sometimes called ‘graph visualization’ or ‘network visualization’, is the process of visually presenting networks of connected entities as nodes and links.
Typically, the nodes represent specific data points, and the links represent the connections between them.
If you need to understand connections in your data, there can be huge advantages to looking beyond your ‘flat’ data model with powerful link analysis tools.
Why do people use link analysis?
The world is densely connected, and link analysis will help you understand those connections.
Unlike other forms of data analysis, link analysis focuses as much on the connections between data as on the data points themselves. That makes it possible to uncover hidden relationships and identify patterns, like dependencies or anomalies, that are not visible in aggregated analysis.

It’s intuitive
Exploring networks as node-link structures instantly makes sense, even to people who’ve never worked with connected data before.

It’s fast
Our brains are great at spotting patterns, but only when the info is in a tangible format. Link analysis helps you identify trends and outliers quickly.

It’s holistic
Link analysis makes it possible to connect data points from diverse sources, breaking down silos for a holistic view of the full data context.

It’s scalable
Link analysis lets you simplify complexity, see context and understand detail. With one chart, you can get an overview or dive into specific connections.

It’s insightful
Through interactive data analysis, you gain deeper knowledge and understand context. That’s hard to achieve with a static, aggregated visualization.
Link analysis use cases
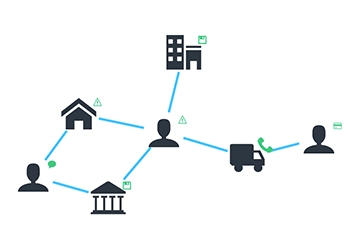
Connected data is all around us, and link analysis makes it possible to understand those connections.
Here are some common use cases for link analysis:
Law enforcement
Reveal connections, understand patterns, predict behaviors and gain insight that can prove, solve or prevent crime.
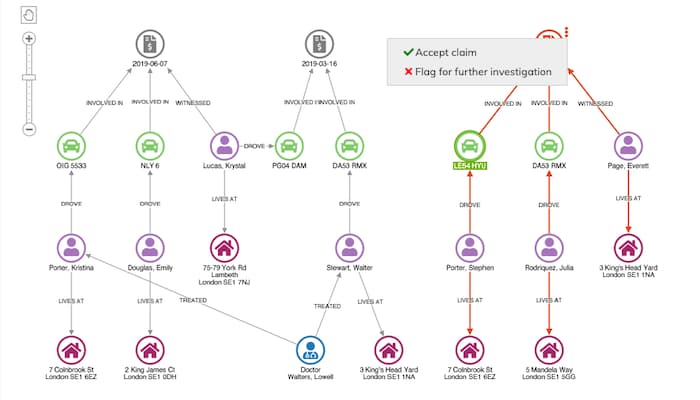
Anti-Fraud
Visualize unusual activities and connections to identify, investigate and predict any type of fraud – from identity theft to financial crime.
Security & Intelligence
Uncover threats and critical intelligence to help make the world safer.
Can’t see your use case here? Check out our use cases page.
Want to try it for yourself?
Our software development kits make it quick and easy to build fully-customized link analysis applications
Link analysis frequently asked questions
Link analysis is a visual data exploration technique for investigating connections and relationships in data.
Link analysis models data as nodes – representing data points – and links – representing the connections between them.
Using this model, analysts can rapidly explore large and complex datasets, identifying patterns and anomalies that would otherwise be impossible to uncover.
Link analysis is widely used in the world of intelligence, where understanding relationships between people, organizations, events, times and locations is critical.
In particular, link analysis reveals intelligence insights like:
- How and when suspects communicate with one another
- How money and information flows within and between networks
- The structure of organizations, gangs or terror cells
- The movements of people or equipment
The information gathered from these investigations helps protect nation states, critical infrastructure, high profile individuals and organizations from threats.
While link analysis is widely used in intelligence, it also has applications in many other domains. These include law enforcement, IT network security, fraud detection and investigation and anti-money laundering (AML).
There’s no real difference: they both refer to the visual exploration of connected data.
Link analysis is the term most widely used in intelligence, law enforcement and fraud management – the domains where connected data visualization originated.
Graph analysis, or graph visualization is a more recent term, associated with a wider range of use cases. Graph visualization is also often associated with graph databases, although a specialized graph database is not actually required for link analysis or graph visualization.
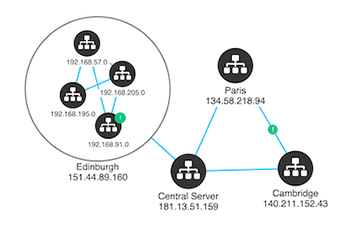
A third term, network visualization, is most often associated with infrastructure and network management where analysts need to understand complex topologies of connected devices.
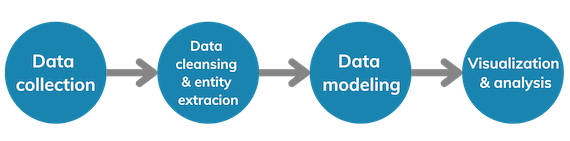
Link analysis requires a step-by-step approach, which will vary depending on individual technology stacks, and the maturity of your data management processes. A generic link analysis process could be:
Step 1 – data collection – from various structured and unstructured sources. A benefit of link analysis is the ability to connect information from disparate silos, for a more unified view of information.
Step 2 – data cleansing and entity extraction – this involves normalizing and deduplicating information, and ensuring nodes and links have the right attributes and identifiers for your analysis.
Step 3 – building the data model – this is the translation of a conceptual model, based on the information you want to uncover, into a logical model, based on the information you have. Read more about data modeling.
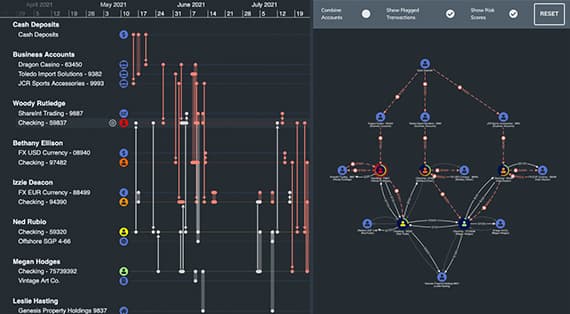
Step 4 – visualization and analysis – this is when you see and interact with nodes and links in a link analysis chart. You can enhance your visual analysis with various techniques and algorithms, including centrality analysis, automated layouts, timeline visualization and node grouping.
KeyLines and ReGraph are two software development kits (SDKs) we’ve built to help developers create powerful link analysis tools. Learn more about KeyLines and ReGraph
KronoGraph is our SDK for timeline visualization. It lets you build fully-interactive timelines that reveal how events unfold and how they’re linked. It’s a standalone toolkit that integrates seamlessly with KeyLines and ReGraph, so users get two powerful ways to perform link analysis in a single view. Learn more about KronoGraph
If you’re ready to choose a link analysis solution, you have several options to consider.
Off-the-shelf applications have a defined user interface and experience built into the software – a one-size-fits-all approach. These are ideal for one-off analysis tasks, with simple requirements.
Link analysis SDKs give the flexibility to design and build custom applications that look and behave as your users need them to. These custom applications are easier to use and more effective as a result. Read more about your link analysis options
We’ve worked hard to ensure link analysis applications built with the KeyLines and ReGraph SDKs ‘just work’ in any setup.
You can keep your existing servers and code in your preferred JavaScript framework. You can also integrate with any data source you like, including graph databases, relational datastore or even no datastore at all.
Check out our products’ technology pages for more information:
Why choose our link analysis software?
At Cambridge Intelligence, we help developers build link analysis tools that are 100% customized to their users, their data and the questions they need to answer.
KeyLines for JavaScript developers
ReGraph for React developers