Data visualization to make the world safer
To defend a country, organization or person, you must first understand threats.
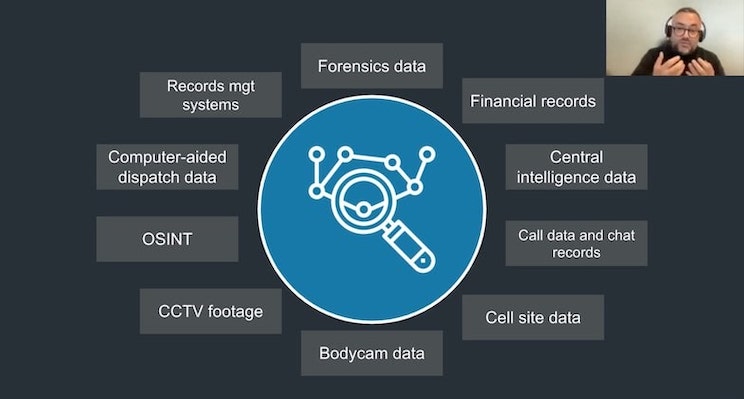
It’s the difficult job of a security analyst to interpret threat information from signals intelligence (SIGINT), open-source intelligence (OSINT), classified databases, and anywhere else, and communicate it to stakeholders at all levels.
That data is big, complex and constantly evolving.
Let’s see how data visualization, especially link analysis and timeline visualization, helps analysts lead fast-moving investigations in a high-stakes environment.
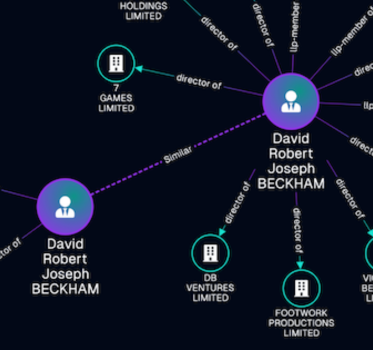
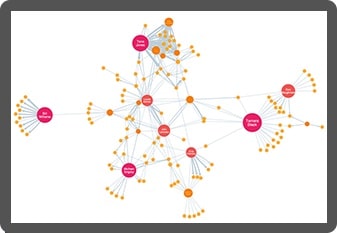
Investigate connections: communication analysis
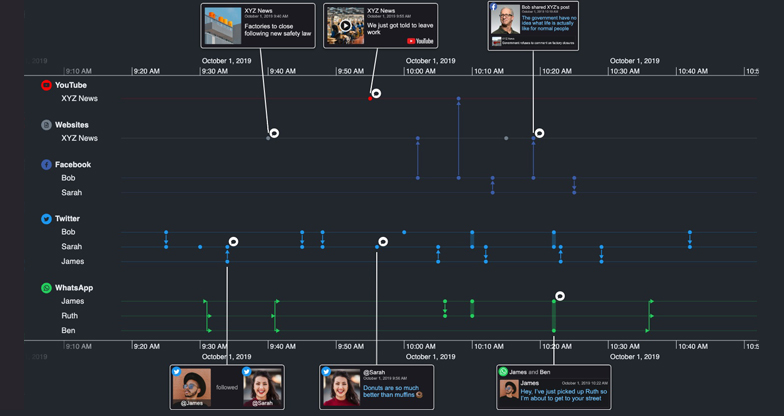
Most investigations involve some amount of communications analysis. As more activity takes place online, call data records obtained by lawful interception gives unparalleled insight into individuals, organizations and their activity.
Using this data to investigate connections, we can join the dots between people, places, times and events.
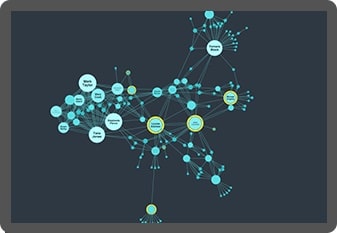
Link analysis intelligence makes large scale communications data easy to understand and navigate, and reveals organizational structures, like terror cells or networks of criminal gangs.
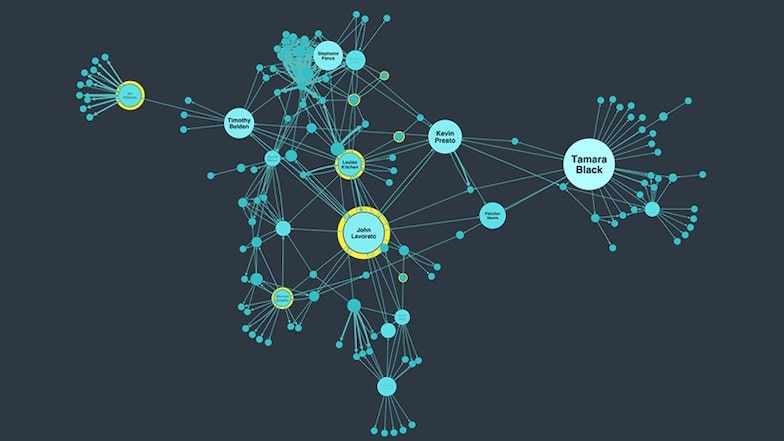
Timeline analysis of lawful interception data shows patterns in communications records, so we can easily see the way relationships develop through time.
See how our graph technology is used by one of our customers to build their product for visualizing communications data.
Learn more in our white paper
See how we help law enforcement agencies power better investigations, incident response and resource deployment.
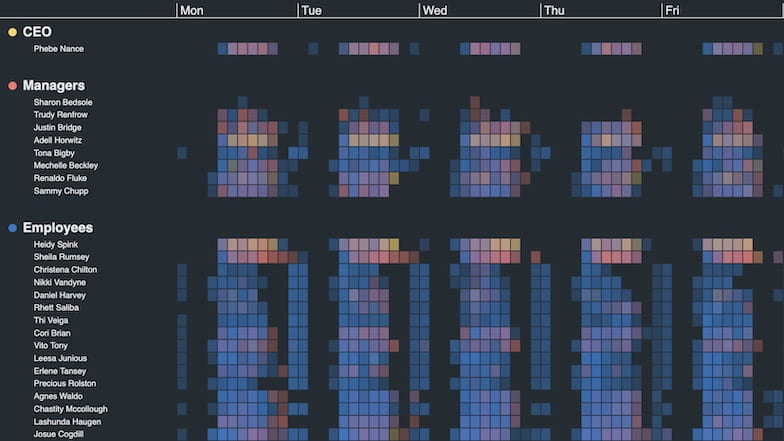
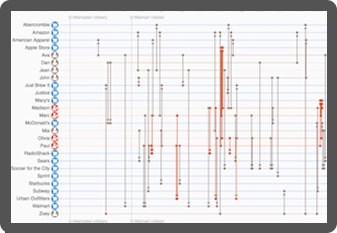
Identify trends: pattern-of-life analysis
To stay ahead of the bad guys, analysts need to understand their behavior.
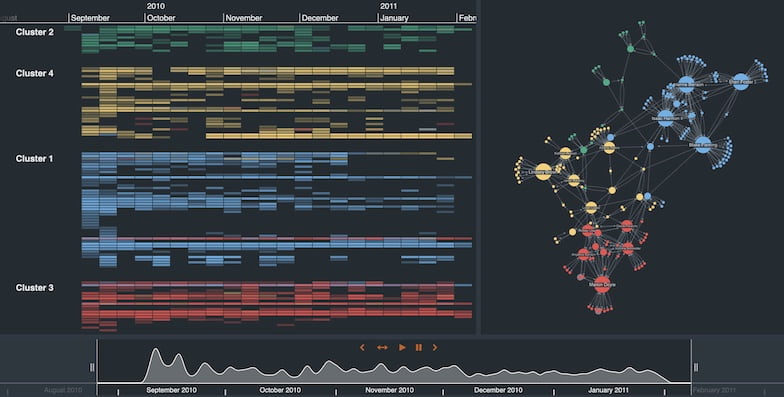
Pattern-of-life analysis involves compiling and analyzing data on a target’s movements and activities to identify routines, anomalies, and indicators of threat.
The human brain is unparalleled at spotting patterns. With the help of powerful data visualization, seeing trends, sequences and outliers is fast and simple.
Timeline visualization reveals relationships between events over time, showing cause and effect and highlighting time patterns that wouldn’t otherwise be visible.
Combined with powerful link analysis, we get a hybrid view that makes it easier to understand the what, who, where and when in your data – providing the insight you need to understand the ‘why’.
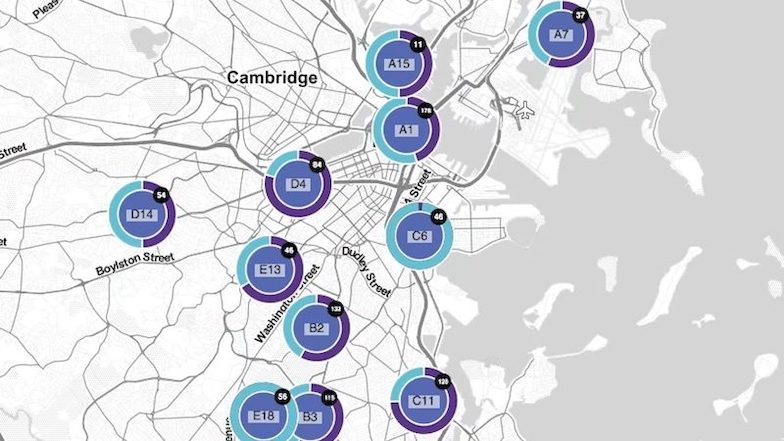
Provide situational awareness: Security Operations Centers (SOCs)
When big events unfold, security teams rely on Security Operations Centers to make sense of what’s happening and to coordinate an appropriate response.
These central hubs provide real-time situational awareness, covering everything that’s happening. Dashboard views that can be quickly interpreted by anyone present.
Interactive and intuitive link analysis and timeline visualizations are a key part of that view.
Timeline visualization makes it easy to look back and understand the consequences of specific events or watch the events as they happen for better real-time decisions.
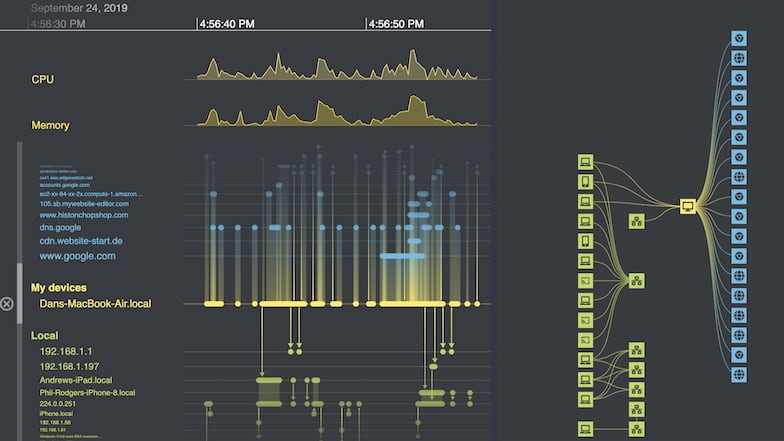
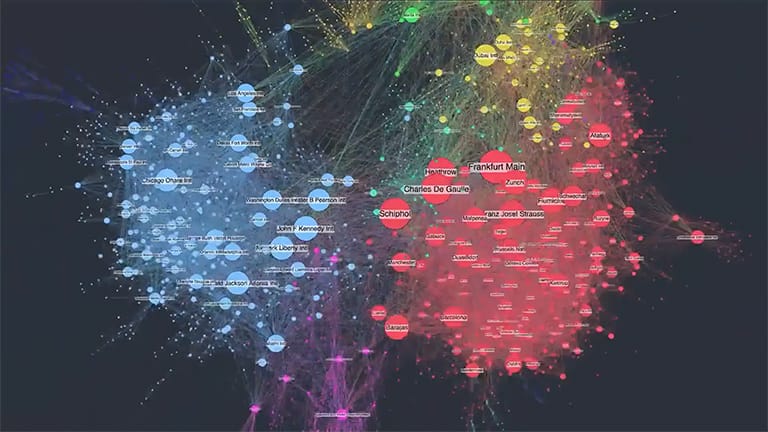
Node-link analysis can be applied to any kind of connected data, from monitoring IT networks, cyber attacks, communications or relationships between people.
Custom data visualization for security and defense
We work with governments worldwide to help them create the next generation security, defense and military intelligence analysis tools.
Using our link analysis and timeline visualization technologies, they’ve built interactive applications that join the dots and reveal the risks and threats they need to understand.

Remove the analysis bottleneck
Intuitive lawful interception visualization tools, custom built for your users and the data they need to understand, empower anyone to find insight in complex data – removing the analysis and visualization bottleneck in the investigation workflow.

Keep your data classified
Design visualization tools suitable for the world’s most secure environments. Our link analysis tools for intelligence and counter terrorism are trusted by government agencies around the world. They sit inside the firewall, don’t track users, never call home and can be easily SSL encrypted.

Build innovative network views
We work year-round to design new functionality in our link analysis and timeline visualization toolkits. With our help, your security analysts will have the best visualization tools to keep them one step ahead.

Get answers faster
Discover new dimensions to your data that aggregated methods can’t show. Timeline and link analysis techniques reveal insight in a uniquely intuitive way, leading to faster decisions and fewer missed threats.
Want to try it for yourself?
KeyLines
Graph visualization for JavaScript developers
Code how you like and build link analysis apps that work with any stack.
ReGraph
Graph visualization for React developers
Use a simple data-driven API to build customized graph visualization apps in React.
KronoGraph
Timeline visualization for JavaScript or React developers
Design interactive timelines to explore patterns and unfolding events.