Security and intelligence
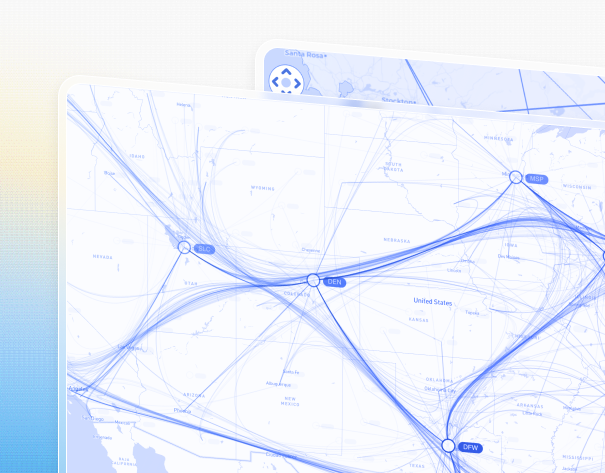
Unify intelligence from communications, devices, locations and events to uncover threats, expose criminal networks and support investigations across intelligence and law enforcement.
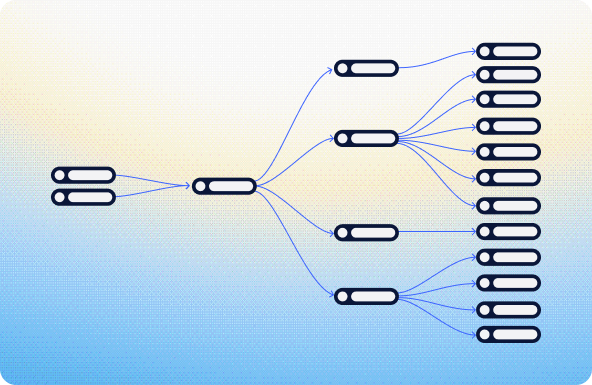
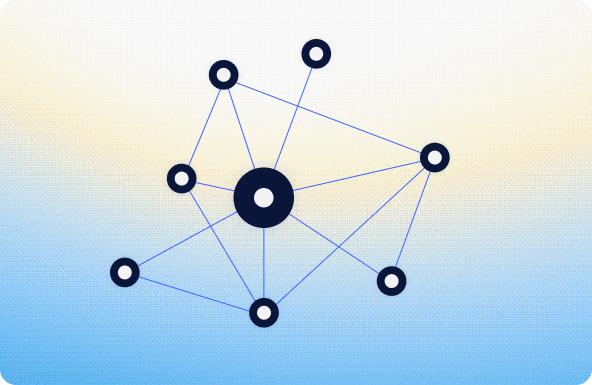
We help teams overcome complex data visualization challenges. Explore how teams use graph, timeline and geospatial visualization to solve real-world problems across industries.
Unify intelligence from communications, devices, locations and events to uncover threats, expose criminal networks and support investigations across intelligence and law enforcement.
Support mission planning, readiness and decision-making across defense and public-sector organizations by visualizing complex systems, assets and operations.
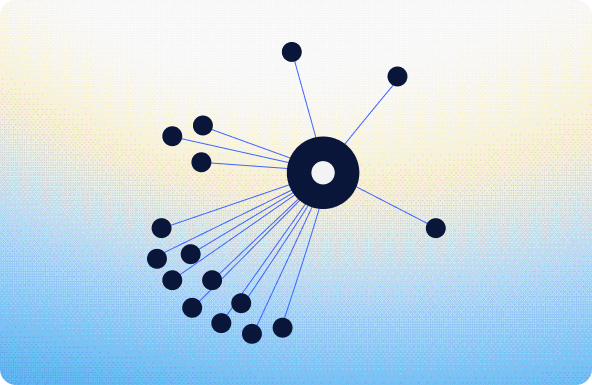
Bring clarity, confidence and interactive intelligence to your product – with visualizations that transform how users understand and explore complex data.