Risk and compliance data visualization
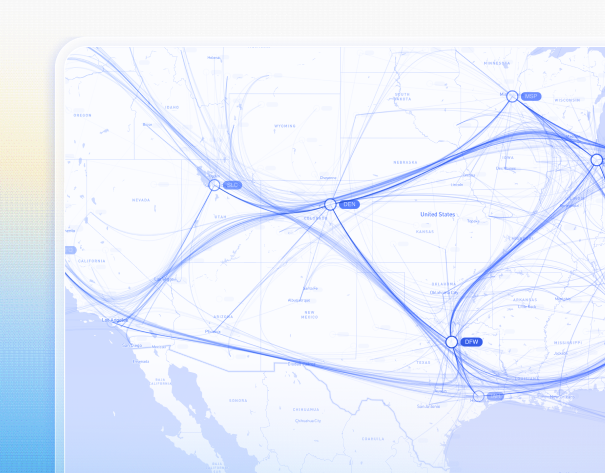
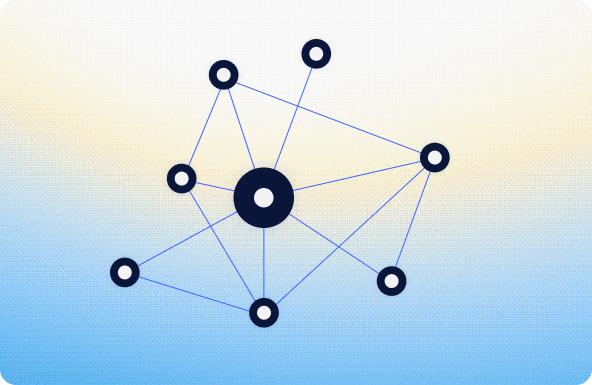
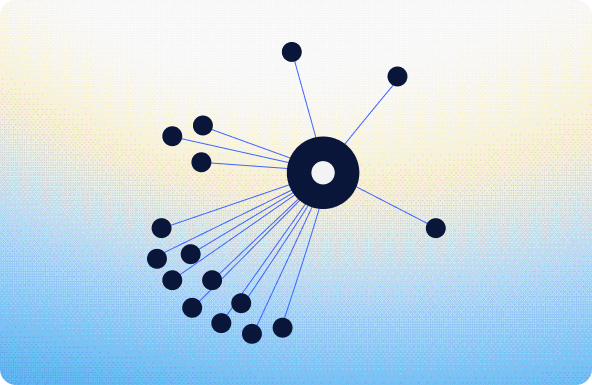
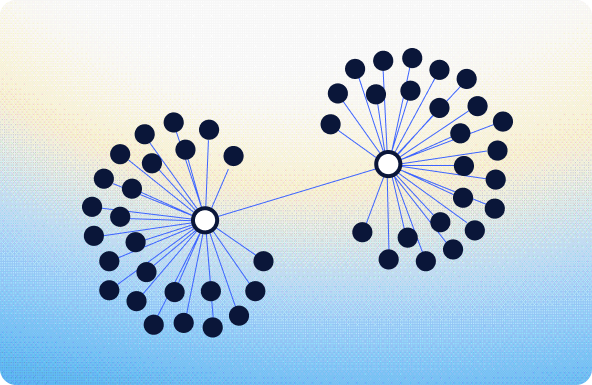
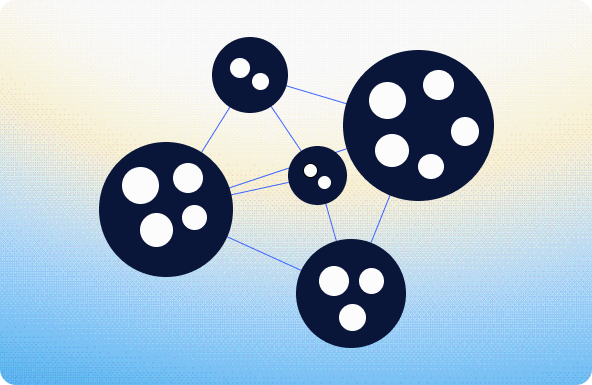
Detect financial crime and uncover obfuscated financial relationships with interactive network, timeline and geospatial visualization.

Trusted by 250+ organizations worldwide
The risk and compliance data challenge
Financial institutions and regulated organizations must manage risk while meeting strict compliance requirements. This includes understanding customer and business relationships (KYC/KYB) to monitoring transactions and maintaining clear audit trails.
These processes rely on data spread across accounts, transactions, entities and ownership structures, often fragmented across multiple systems. At the same time, financial crime such as fraud, money laundering and sanctions evasion operates through complex networks that are difficult to detect using traditional dashboards or reports.
Teams need to understand:
- How entities are connected
- How activity unfolds over time
- Where risk is concentrated
- Ensure decisions are transparent and defensible
Interactive visualization helps teams gain the context needed to investigate risk, support compliance and meet regulatory obligations.
Use cases
Anti-money laundering and fraud detection
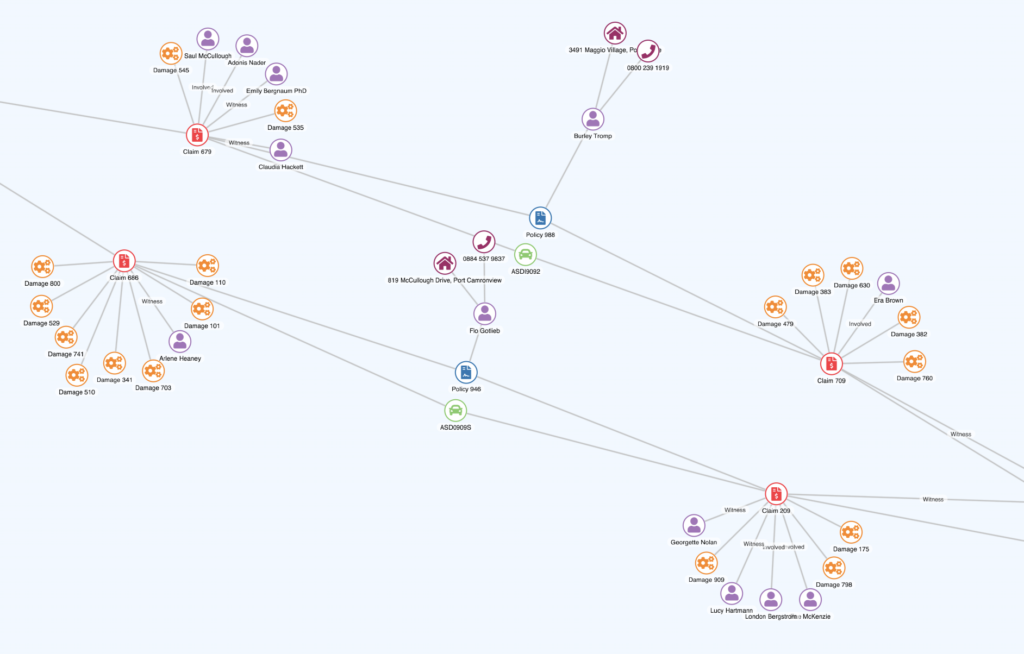
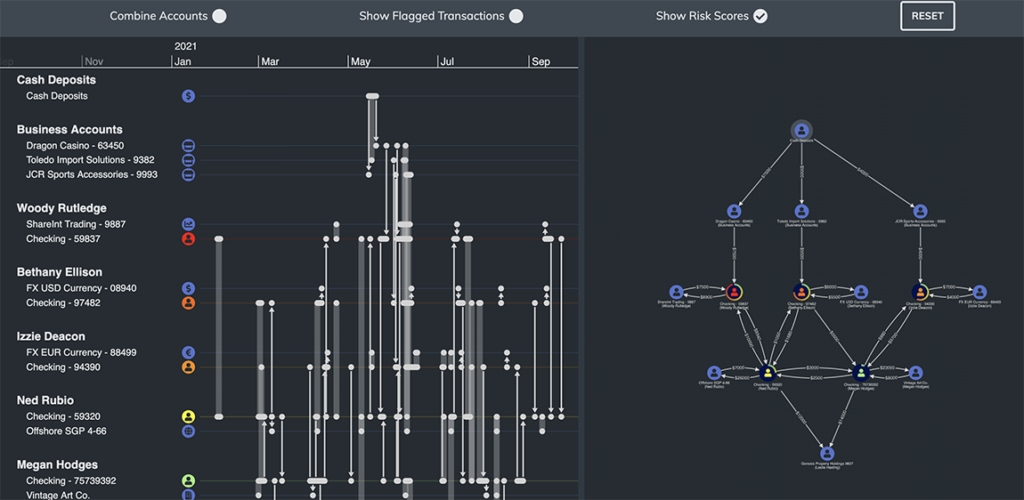
Analyze transaction networks and entity relationships to identify suspicious activity, detect fraud and uncover money laundering patterns.
Customer due diligence (KYC/KYB)
Understand relationships between customers, business and beneficial owners to assess risk, verify identities and meet regulatory requirements.

Regulatory compliance and auditability
Maintain clear, traceable views of transactions and relationships to support compliance reporting and demonstrate decisions to regulators.
Market surveillance and risk monitoring
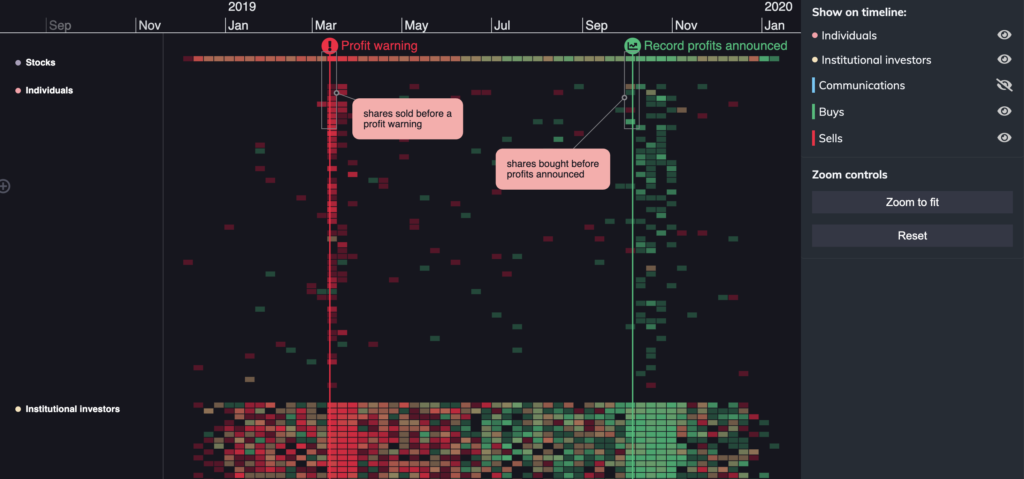
Monitor trading activity, relationships and patterns to identify market manipulation, assess exposure and manage financial risk.
Build platforms for financial risk, investigation and compliance
Enable teams to explore complex financial data, understand relationships and activity, and support decisions that stand up to regulatory scrutiny.

-
Transform complex financial data into clear, interactive visualizations
Bring together data from accounts, transactions, entities and ownership structures to help users understand relationships and risk.
-
Uncover obfuscated relationships and risk exposure
Help users find connections between individuals, organizations and transactions to identify suspicious patterns and areas of concentrated risk.
-
Support transparent, defensible decision-making
Present data in a way that makes decisions easier to explain, justify and audit so teams can meet regulatory requirements and maintain compliance.
-
Design for regulated workflows and diverse stakeholders
Tailor the experience to support complex financial workflows, from fraud investigation and compliance reviews to regulatory reporting to ensure clarity for analysts, risk teams and external auditors.
-
Support continuous monitoring and audit at scale
Work with large, evolving financial datasets while maintaining performance and reliability for your users.
Risk and compliance demos
Try these interactive demos in your browser.
See more use cases
Frequently asked questions
How is visualization used in risk and compliance workflows?
Visualization helps teams understand relationships between entities, transactions and ownership structures to assess risk and support compliance.
How does visualization support investigations and regulatory audits?
It provides clear, traceable views of activity and relationships so its easier to investigate issues and justify decisions to regulators.
Does visualization replace existing risk and compliance tools?
No, our SDKs integrate into your existing platforms to enhance how users explore and understand their connected data.
Is this suitable for regulated and high-risk environments?
Yes. Our technology is used in mission-critical systems where security, performance and reliability are essential.
Ready to visualize your connected data?
Bring clarity, confidence and interactive intelligence to your product – with visualizations that transform how users understand and explore complex data.