In this blog post, we use bitcoin visualization to track how one charity’s clever cryptocurrency activity boosted donation values by almost 300%.
When cryptocurrency makes headline news, it’s usually for the wrong reasons. Stories of volatile prices, ransomware attacks like WannaCry, money laundering scams and crypto exchanges violating Know Your Customer (KYC) legislation are rife.
But there are good news stories too. We’ll bring one of these to life – with the help of our data visualization tools – and show how the UK’s Royal National Lifeboat Institution (RNLI) navigated the complex cryptocurrency world successfully.
Why did RNLI start accepting bitcoin?
Since 1842, the RNLI’s search and rescue teams have saved around 143,000 lives from the UK’s inland and coastal waters. They rely on volunteers to run a 24-hour service but depend on donations to fund lifeboats, lifeboat stations, lifesaving equipment and training.
As early as 2014, RNLI research identified digital currency as a growing trend they needed to be part of. They wanted the ability to accept digital donations and reach new supporters, as well as donors abroad who were keen to avoid expensive money transfers using traditional banking methods.
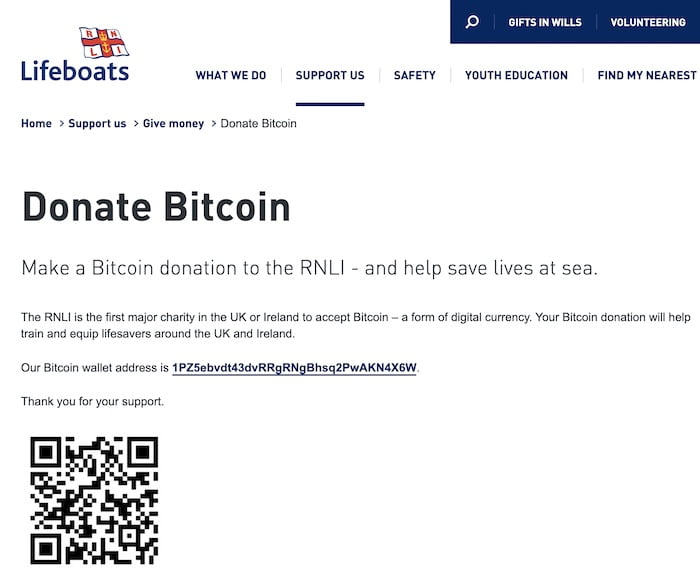
As the first major UK charity to accept bitcoin, it was an innovative step. So what has their cryptocurrency experience been like? Let’s take a close look at their bitcoin activities.
New to cryptocurrency & blockchain technology?
Building a bitcoin visualization of RNLI donations
Using ReGraph, our graph visualization tool for React developers, we built a simple app to make identifying RNLI’s bitcoin donations easier.
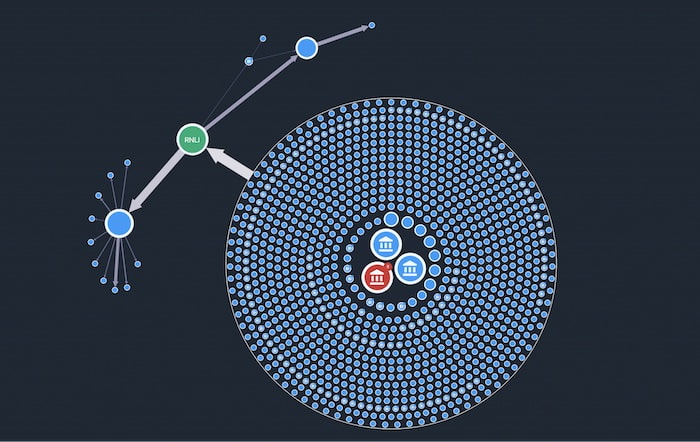
This bitcoin visualization shows that the RNLI has received 1,654 donations to date. Effective custom styling makes it easy to spot what’s happening:
- nodes represent bitcoin addresses or wallets containing multiple addresses
- nodes decorated with a building icon represent cryptocurrency exchanges
- links represent bitcoin transactions and they’re sized according to the transaction value: the wider the link, the greater the value
Our bitcoin visualization is fully interactive – clicking on a link reveals detailed information about the transaction in the right-hand panel.
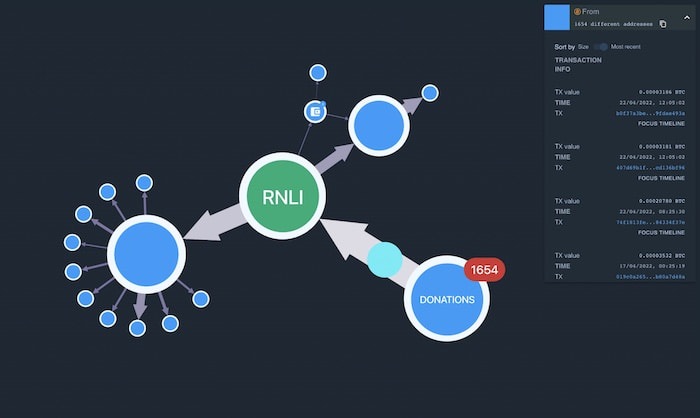
We’ve decorated the donations node with a glyph. This tells us the total number of addresses that sent donations. It’d be overwhelming if we showed all the donations at once, so we’ve grouped them in a combo.
To reveal all 1,654 donations, we double-click on the combo.
The combo displays higher value addresses in the center so they’re easier to spot. Nodes are sized depending on the amount of bitcoin donated. Notice that the largest nodes are those which we’ve identified as exchanges.
Tracking the path of RNLI donations
From our bitcoin visualization, we see that RNLI transfers donations to three addresses, and link widths tell us that they send different amounts to each. Next, the bitcoin is forwarded again to another series of addresses.
So far we’ve used an organic layout for nodes and links to help identify the overall structures of the data. Now let’s change this to a layout that’ll arrange the series of addresses into distinct levels – we call this sequential layout.
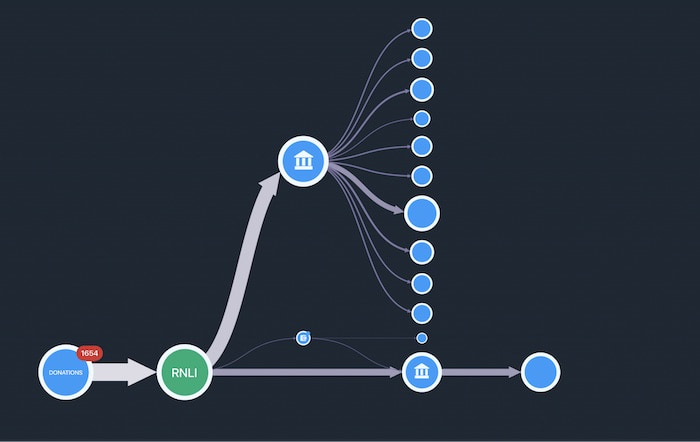
Now the donations flow from left to right, making it easier to examine each stage of the bitcoin trail. We see that the RNLI sent their donations to two exchanges, presumably so they can cash out and put those donations to good use.
There’s another way we can explore the RNLI’s transaction history. Let’s bring timeline analysis into the mix.
Adding time-based analytics to our bitcoin visualization
KronoGraph, or timeline analysis toolkit, lets us look at the same data in a new way. By focusing on how and when events unfold, we discover interesting patterns of behavior or distinct outliers.
Our bitcoin visualization app now includes a couple of time series charts and a timeline visualization.
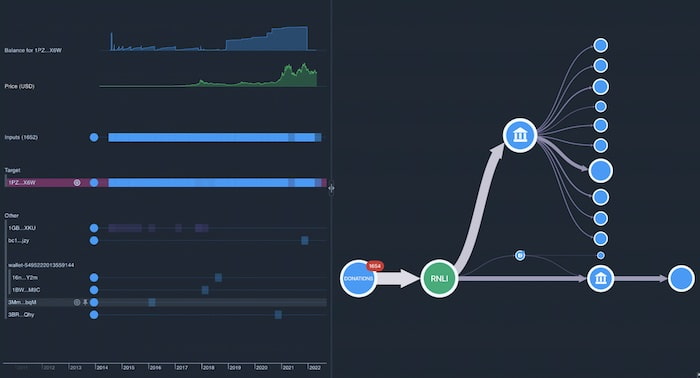
In the timeline, we’ve selected the RNLI bitcoin address, truncated as ‘1PZ_X6W’. You can see it highlighted under ‘Target’.
The blue time series chart in the top left shows the balance for that address between 2014 and 2022. It shows a regular pattern between 2013 and 2019 where donations built up over short periods and were then exchanged. As soon as the balance for that bitcoin address reached 1 bitcoin, they’d cash out.
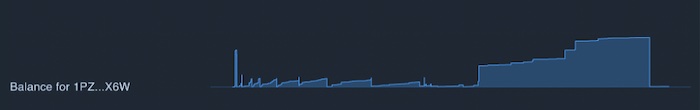
But, in 2019, this pattern stopped. The RNLI began holding the bitcoin in the address for longer, allowing their balance to reach nearly 6 BTC by December 2021. Why the change in behavior?
The second time series chart provides the answer.
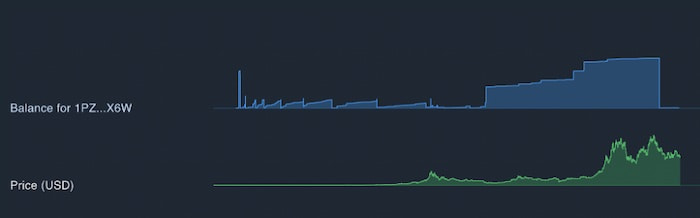
The green chart gives us the volatile Bitcoin price in $US. It shows that, in general, bitcoin has increased in value over time, reaching a record £68,000 in November 2021.
So in early 2015, the RNLI’s 6 bitcoins would be worth $1,116. Not bad. But in December 2021, that same Bitcoin would be worth somewhere in the region of $300,000. The RNLI can do a lot of good with that money! Changing their cash-out strategy certainly paid off.
In this bitcoin visualization we’ve annotated the timeline to instantly spot the date when the RNLI cashed out.
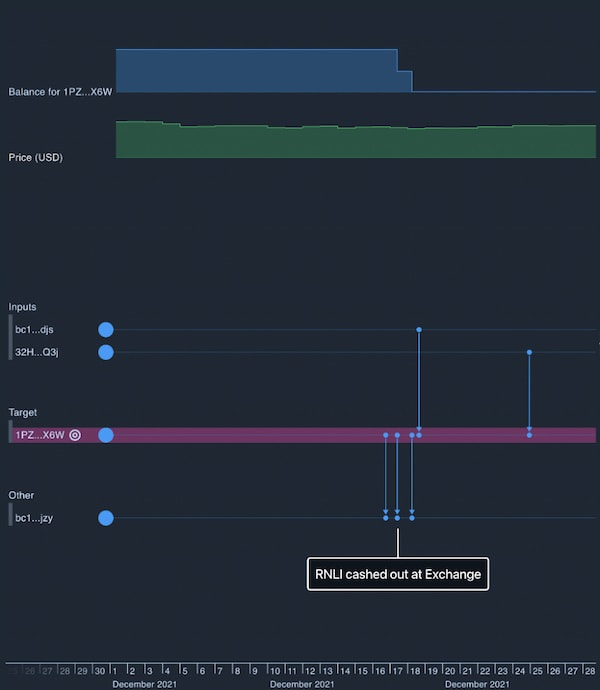
We can deduce that in the earlier years when market confidence in bitcoin was low, the RNLI chose to cash out frequently. But as bitcoin adoption grew and the price began rising sharply, the RNLI held onto their bitcoin, assuming its value would continue to grow.
Between February and December 2021, bitcoin saw incredible price gains. Then in December, the price started to fall again. The RNLI cashed out at a great time, making thousands for their worthy cause in the process.
Bitcoin visualization for the win
More charities have followed RNLI’s lead and now accept bitcoin donations, although many still see it as risky, volatile and potentially damaging to their reputation. For example, the WikiMedia Foundation, the non-profit organization behind Wikipedia, recently stopped accepting bitcoin donations in response to protests from the Wiki community about its environmental impact.
What’s clear from our bitcoin visualization is that the RNLI changed their strategy at the right time to benefit its cause. Using graphs to explore the network, timeline to see how events unfolded and time series charts to provide important context, we got a deep understanding of their journey with cryptocurrency so far.
Looking to build your own blockchain investigation tool?
If you need to make sense of your connected data, sign up for a free trial of our toolkits.
Share: