In this blog post, we build a Next.js data visualization app with the ReGraph graph visualization SDK. We’ll test the latest Next.js features and see if they deliver a better developer and end-user experience.
I’m also interested in blockchain technology, so the application we use is a cryptocurrency analysis tool I built for fun as a sideline project.
About Next.js
If you work in the React ecosystem, you’ve probably heard of Next.js by Vercel already. There are many React frameworks, but NextJS stands out because of its focus on improving the developer workflow and delivering a zero-config experience.
![]()
Earlier versions of Next.js had a lot of powerful features already, my favorite being their API routes. Version 12 includes new features to enhance and speed up apps. They’ve overhauled the Next.js compiler and rewritten it using Rust programming language to make build times up to 5 times faster.
The release also includes React server components. These improve on server-side rendered (SSR) components because the server not only generates the HTML, it renders the component itself on the server. This takes the power of server-side computation to the next level: it doesn’t need to send JavaScript to users, making page loading faster than ever. This can even be done on a component-by-component basis, and is as easy as renaming a component’s file from `.js` to `.server.js`.
Migrating our app to Next.js
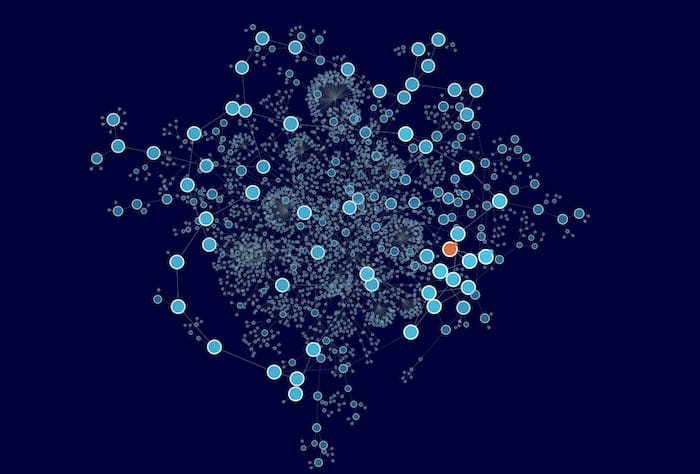
To start our Next.js data visualization, we need an app. I’ve used ReGraph to build a simple one that visualizes the complex network of connections between cryptocurrency transactions./p>
The app lets you import your blockchain asset data and view it in relation to other entities you’ve traded with. Here’s an example of a trader’s bitcoin addresses and their transactions with others.

Since Next.js is just a framework, our Next.js data visualization app is not going to look any different once we migrate. Instead, we should benefit from additional performance speed and easier maintenance.
Once migrated, we notice error messages from our ReGraph component.
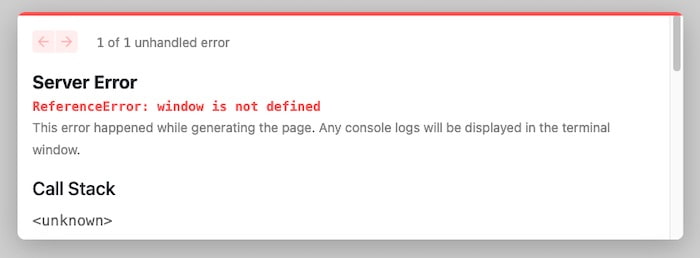
The errors are because Next.js is trying to pre-render our visualization on the server, which doesn’t make sense for the app we want.
Our ReGraph app uses HTML5 Canvas to draw the chart, although ReGraph supports WebGL too. It doesn’t make sense for the server to render ahead of time, especially when users are going to interact fully with the chart through clicks and drags. The canvas itself also provides a much more performant way to draw charts as opposed to using native DOM elements.
To solve the error, we use Next.js’s dynamic import to load the component at runtime. This turns off app screen Server Rendering so that ReGraph can have the control it needs over the page. Thanks to Next.js’s modular rendering, we can still use Server Rendering everywhere else in our app – including in other components on the page – so we’ll still benefit from improvements.
import React, { useState } from "react";
import dynamic from 'next/dynamic';

const DynamicComponentWithNoSSR = dynamic(() => import('./Chart'), {
 ssr: false
});
Rebuilding the app using hot reloading
As our app was built in React using the ReGraph toolkit, the rest of the migration is relatively straightforward.
I notice that the build time is around 3.5 times faster. But the real win comes from the Next.js Fast Refresh hot reloading experience, which gives instant feedback on component changes.
When I develop using hot reloading, I tend to rebuild my project once every few minutes. A rebuild time of just 4 seconds can cost half an hour over the course of a day. Next.js now logs its build times in the console, so we can see if our project is costing us more time.
$ next dev
ready - started server on 0.0.0.0:3000, url: http://localhost:3000
wait  - compiling...
event - compiled successfully in 94 ms (381 modules)
wait  - compiling...
event - compiled successfully in 60 ms (381 modules)
wait  - compiling...
event - compiled successfully in 89 ms (380 modules)
wait  - compiling...
event - compiled successfully in 46 ms (380 modules)
wait  - compiling...
event - compiled successfully in 72 ms (380 modules)
wait  - compiling...
event - compiled successfully in 37 ms (380 modules)
In fact, the hot reload feature is much faster than in previous versions. Next.js is now optimized to rebuild only those modules that changed. Those recompile times of <100ms are less than it’d take to switch from an IDE to the browser, and that’s as fast as we’ll ever need.
Impressive load times for better UX
The developer experience is definitely better, but what about the user experience? What improvements do our app users benefit from?
Using some basic benchmarks, we use Lighthouse to compare the load times of pages in our app before and after migrating to Next.js.
 <figcaption=”regraph after=”” and=”” app=”” before=”” data=”” figcaption=”” for=”” metrics=”” migration<=”” next.js=”” our=”” performance=”” visualization=””> </figcaption=”regraph>
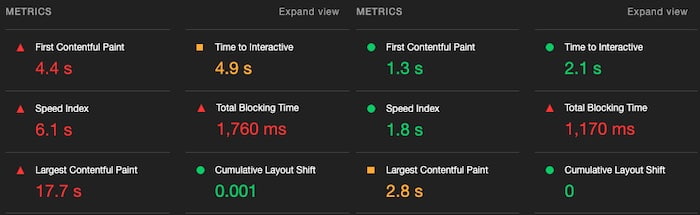
The results are positive but varied.
Our main app only received a 10% increase in load time (First Contentful Paint), but since we couldn’t use help from the server for rendering ReGraph, that’s still pretty good.
‘Time to Interactive’ has been optimized thanks to Next.js’s ability to separate components when deciding what rendering to use. We even gained ground in the total blocking time – now 1,170ms compared with 1,760 before – which is surprising as most of that is due to our large data queries to an external API. Is Next.js prioritizing sending the requests and then focusing on rendering while we wait for the result? Either way, we’ll take it!
The homepage, which is completely static, loads over 3 times faster, which is great. These changes aren’t usually that visible on desktop apps like ours, but when I try it on a mobile web browser using 3G, the difference is noticeable.
Putting Next.js edge functions to the test
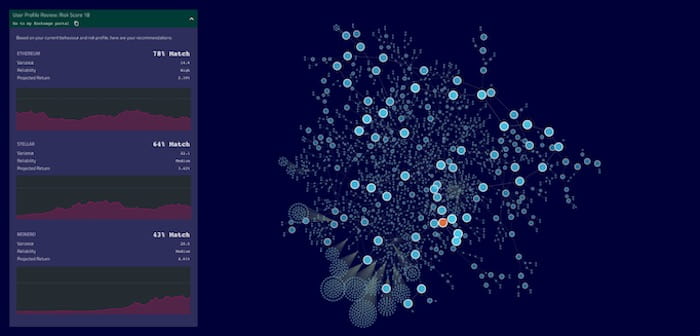
Now comes the fun part. We’ve blogged before about using data visualization to better understand cryptocurrency and blockchain. I want to try something new in my app: to implement an investment recommendation engine that could help users decide on the best currencies to back right now. It recommends cryptocurrencies based on personalized data that includes their previous investment behavior and a risk profile generated from questionnaire responses. This data determines their comfort with risk and matches it with currencies’ level of potential risk-reward ROI.
Before migrating to Next.js, it took so long to load the amount of personalized data configured at the server level for each request to get the recommendation engine working that the app was unworkable. Even with small volumes of data, there was always a trade-off between fast loads and personalized content.
But with Next.js’s new edge functions, we can improve this. Edge functions cache user data on Vercel’s distributed network of servers, so the content for each user is held on a server close to their location, speeding up load times.
I’m running my app locally, so the server is on the same machine as our browser. To take advantage of edge functions, we need to deploy to a review environment. Edge functions are only available when you use Vercel’s servers, so we deploy our new version there. Next.js already makes this really easy too. In fact, once we’ve attached our Vercel account to our repo, the only thing we need to do is to push our code!
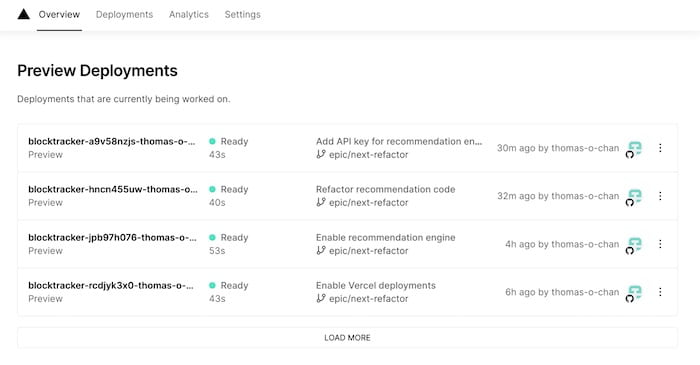
Vercel creates a review environment for every branch in your repository and creates new ones every time you push new commits.
And here’s the personalized content in the app, suggesting three cryptocurrencies together with details and time series charts of recent activity for each. While it does still take a couple of seconds for the app to load all the data, this isn’t noticeable as the chart itself still loads just as fast. By the time a user has time to open the recommendations, the data has arrived and we can populate the results.
The verdict on Next.js data visualization with ReGraph
Next.js is a great new framework for our cryptocurrency app. We benefit from speed of development and improved end-user experience, so much so that we can include high-volume personalized content in our app for the first time. Thanks to ReGraph’s architecture-agnostic design, it slotted seamlessly into the new tech stack.
If you’re keen to try ReGraph with Next.js or any other React framework, request a free trial.
Share:
