Building with ReGraph
Build high performance React graph visualization tools quickly
How does ReGraph work?
ReGraph is a toolkit for visualizing graph data in React. It provides a number of fully-reactive, customizable components that you can embed in your own applications.
It has two visualization components: a chart and a time bar. Use props to push your data into them and they’ll update automatically.
To update, filter, style or highlight items in the data, push an updated item’s object into the component on the next render. ReGraph will smoothly update the React graph visualization to reflect the change.
Like other React components, ReGraph sits in the front end of your application – completely separate from the back end. Data is passed as a plain JavaScript object: it’s up to you how to deliver data to the client.
// A simple, familiar way to write React code

import React from 'react';
import { Chart } from 'regraph';

const FamilyTree = () => (
<Chart items={{
    luke: {label: {text: 'Luke Skywalker'}},
    leia: {label: {text: 'Princess Leia'}},
    link: {
      id1: 'luke',
      id2: 'leia',
      label: {text: 'Siblings'},
  }
}}/>
);
Why use ReGraph for your React graph visualization?

Designed for React, and only React
If you’re a React developer looking for a graph visualization toolkit, ReGraph is designed for you.
Enjoy all the benefits of React including component-based state and data flow management, efficient rendering, and JSX-coded elements with clear syntax. The data-driven API is intuitive and declarative: you describe what you want ReGraph to draw, not how to draw it.

Robust & advanced features
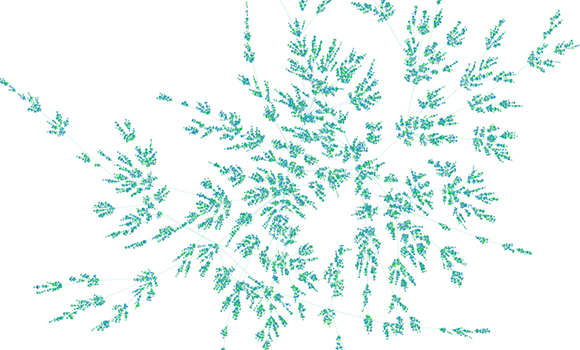
ReGraph comes loaded with high-performance features to analyze your biggest datasets.
ReGraph components allow you to visualize time-based and geospatial data, while advanced layouts and graph analysis functions help you make sense of it. There’s also powerful rendering of large data sets across all modern browsers.

It’s scaleable & flexible
ReGraph is completely separate from the back end. You can choose whatever system you want to integrate with, and whatever data source you want to visualize.
You can also take advantage of React’s complementary tools and features including Redux, Flux and Hooks.

High-quality developer experience
A fully-documented API and detailed developer guides provide expert first-line support.
There are dynamic demos for every feature with downloadable examples to save you coding from scratch. And if you contact support, our experienced React developers are here to help.
Learn more about ReGraph, our Graph visualization SDK for React
Find out how we help governments, banks, and leading software vendors build powerful graph visualization tools for their cyber threat intelligence analysis.
Lightweight, secure and scalable
ReGraph is a front-end application that works seamlessly in any environment. No need to change your existing setup: you choose where to host it.
Fully agnostic, ReGraph works with virtually any data repository. For added security between server and web browser, simply set up a secure channel using SSL. There’s no need for specialist visualization servers. ReGraph’s simple, state-driven API renders the graph every time your data changes.
Powerful, fast and easy to use
ReGraph components use WebGL rendering under-the-hood for fast performance. This offloads much of the heavy lifting to the device’s GPU.
The additional processing power means you can visualize large and complex networks easily. Can’t always use WebGL? As a fallback, there’s HTML5 Canvas. It uses the same API, so no need to worry about which platform you’re running on.
Minimal dependencies
ReGraph works with React, and the core library has a third-party dependency on the lodash utility library.
If you’re using map mode, add Leaflet version 1.3.4 to your project and import it into your app. This’ll draw map tiles and handle user interactions.
If you’re using font icons, use the FontLoader component included in the ReGraph package and make sure fonts are loaded on the page before redrawing the chart.
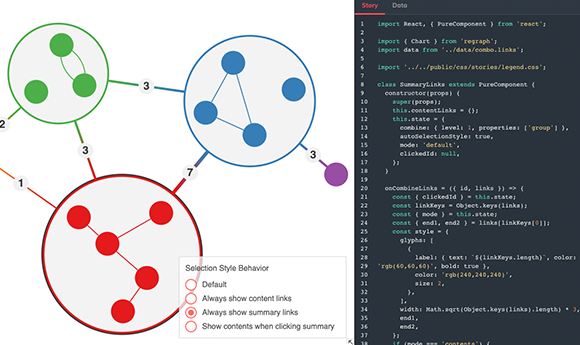
The ReGraph playground
ReGraph comes with its own live-coding environment designed for rapid prototyping and sharing code more easily.
With the playground you can create instant React graph visualizations from any of the code examples on the ReGraph SDK site.
It makes collaboration much simpler too. Once you’re ready to show colleagues your ideas, just share the hyperlink.
Trusted by developers
Many high profile applications around the world use our visualization technology.


Cambridge Intelligence has been a great partner to work with. They provided design examples, interactive sandbox options, and optimal ways to graph for our varied data scenarios. They’ve been very responsive and helpful whenever the developers have had questions or issues, and continue to understand our use cases and ensure we’re following best practices.
Jacob Wagh, Director of Product Management at SpyCloud
Any browser, any device
ReGraph works in all major browsers on desktops, tablets or cell phones.
Integrate with your favorite database
ReGraph works with virtually any database. If your data can be parsed into JSON format, ReGraph can visualize it.


Frequently asked questions
React is the most used JavaScript framework in the world. Its component-based approach allows you to build encapsulated components that manage their own state.
React updates and renders just the right components when your data changes. So, it’s suitable for scalable and high-performance apps.
Similar to how React performs a diff on the DOM, ReGraph diffs your data and only updates the necessary elements in your chart. ReGraph can handle large data sets and will smoothly transition between states as elements are added and removed from the chart. Want to learn more? 5 reasons React developers love ReGraph
No. ReGraph is a commercially-licensed React SDK. Having a dedicated team on the project means we can guarantee frequent releases, fixes and expert support. Trying to decide whether to buy an application, build something yourself or use an SDK? We’ve compared the options.
Performance rates depend on many factors including server hardware, browser and size of the React graph visualization.
The ReGraph WebGL renderer can handle networks of 100,000 items, but in reality, the human brain can only interpret a few hundred nodes at most. Your users can rely on ReGraph’s advanced filtering, grouping and graph analysis features to manage the data and find the insight they’re after.
ReGraph works with any data repository – databases, web services (REST API, GraphQL API), CSV files, etc. All you have to do is convert the data into the simple JavaScript format ReGraph understands. You’ll find descriptions of every supported prop, event and style option on the ReGraph SDK site.
If you are worried about converting all your data into a graph format, our graph data modeling tutorials should help.
Once your data is converted to the JSON format ReGraph needs, objects are sent to the client and passed to the chart’s items prop ready to be rendered to the chart.
Getting started with ReGraph is easy. Just request a free trial account to get access to detailed API documentation, interactive demos, sample codes and expert support.
Want to learn more before commiting to a trial account? See our getting started guide for a step-by-step tutorial that covers everything you need to design your React graph visualization application with ReGraph. Rather watch a video? Here’s a quick tour of ReGraph’s API.
We built ReGraph specifically to meet the needs of React graph visualization developers. If you’re looking for a high-quality graph visualization SDK for plain JavaScript, take a look at our KeyLines instead.
React developer resources


Tutorial: Material UI data visualization


Tutorial: Next.js data visualization with React

Webinar: A tour of the ReGraph API