
We recently launched ReGraph, our new graph data visualization toolkit for React developers. The response so far has been fantastic!
To help you get started with our React graph visualization toolkit, this step-by-step tutorial covers everything you need to know. Once we’ve created our visualization in a React app, we’ll load an example network of suspected terrorists and show how easy it is to apply the key analysis techniques your users need to uncover threats.
Before the tutorial, let’s learn a little more about ReGraph.
ReGraph: How it works
If you’re looking for a high-quality, easy-to-build graph visualization component to add to your React application, ReGraph is a real game-changer. It’ll also give your users the advanced interactive analysis experience that’ll help them find insight into their most complex networks of connected data.
ReGraph contains two React components, a chart and a time bar. Both components are designed from the ground up to fit into modern React environments. The fully data-driven approach allows for modern, responsive and declarative visualization of your data.
Powered by powerful WebGL graphics rendering, ReGraph offers fast, reliable performance even when visualizing large, complex networks. And like React, it works with all major browsers and devices.
ReGraph comes loaded with high-performance graph analysis functions and other features to help analysts discover critical insights more quickly. They can take advantage of social network analysis measures, advanced map-based visual analysis, automatic graph layouts, node grouping and combining, and much more.
We’ll look at a couple of these in more detail – but first, let’s get ReGraph working in an app.
Step 1: Add ReGraph to your React project
If you don’t have a React project set up, you can bootstrap one in seconds with create-react-app:
npx create-react-app my-regraph-app
Next, download ReGraph. If you haven’t done so already, sign up for a free trial. You’ll get full access to the ReGraph SDK site containing the latest ReGraph package, detailed developer tutorials, interactive demos and a fully-documented API.
Add ReGraph to your project by installing it with a package manager. We’ll use npm:
npm install ../path/to/regraph-0.5.0.tgz
Step 2: Import ReGraph and create a chart
To access ReGraph from your app, simply import it alongside React:
import React from ‘react’;
import { Chart } from ‘regraph’;
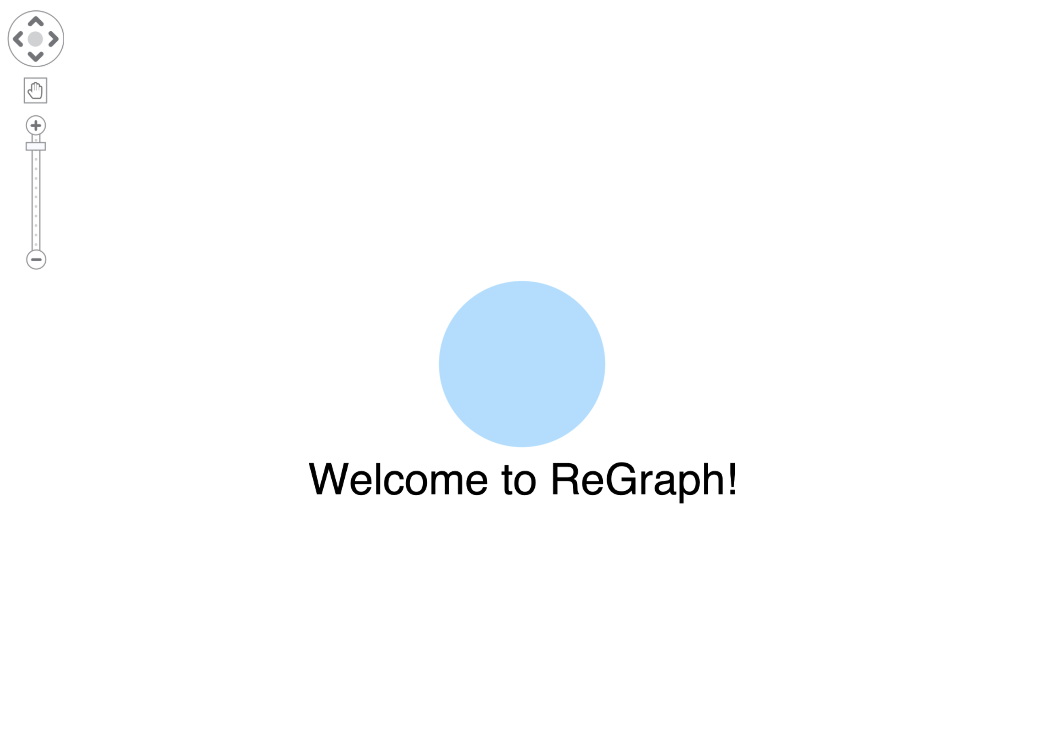
You can then render the Chart in JSX. To create a chart and load a dummy item, use:
<Chart items={{
   node1: {
      color: ‘#bbdefb’,
      label: { text: 'Welcome to ReGraph!' }
    }
}}/>
And that’s it: ReGraph is running in your application!
Step 3: Load data
ReGraph works with any data repository – databases, web services, CSV files, etc. All you have to do is convert the data into the simple JavaScript format ReGraph expects. Here’s what our converted network of suspected terrorists looks like:
// A node with id N8
N8: {
  color: '#ff867c',
  label: {
    text: 'Mohammed Ibrahim Makkawi',
  },
  data: {
    country: 'Afghanistan',
  }
},
// A link between N8 and N99
'N8/p/N99': {
  id1: 'N8',
  id2: 'N99',
  width: 5,
  color: '#f3e5f5'
}
You’ll find descriptions of every supported prop, event and style option on the ReGraph SDK site.
Next, we pass this object into the items prop of our chart and ReGraph automatically draws it for us. In a React app, we usually load our items from the app state or props. We’ll read from state in this example, which means we can re-render whenever the items change:
componentDidMount() {
  const data = await loadData();
  const items = convertData(data);
  this.setState({ items });
}
render() {
  const { items } = this.state;
  <Chart items={items} />
}
The items prop is fully reactive. When you pass a new object into it, ReGraph looks for changes since its last render and updates the chart if necessary. New items slide into view, removed items fade out, and color and position changes transition with smooth animation.
That’s it! We’ve got our chart working and our data loaded. Now let’s see how we can make sense of our chart.
Make sense of your graph visualizations
Right now, it’s hard to get useful insight from our complex network of connections, but ReGraph comes with a range of features to help you understand the data. Let’s focus on two of them: combos and SNA measures.
Reducing clutter with combos
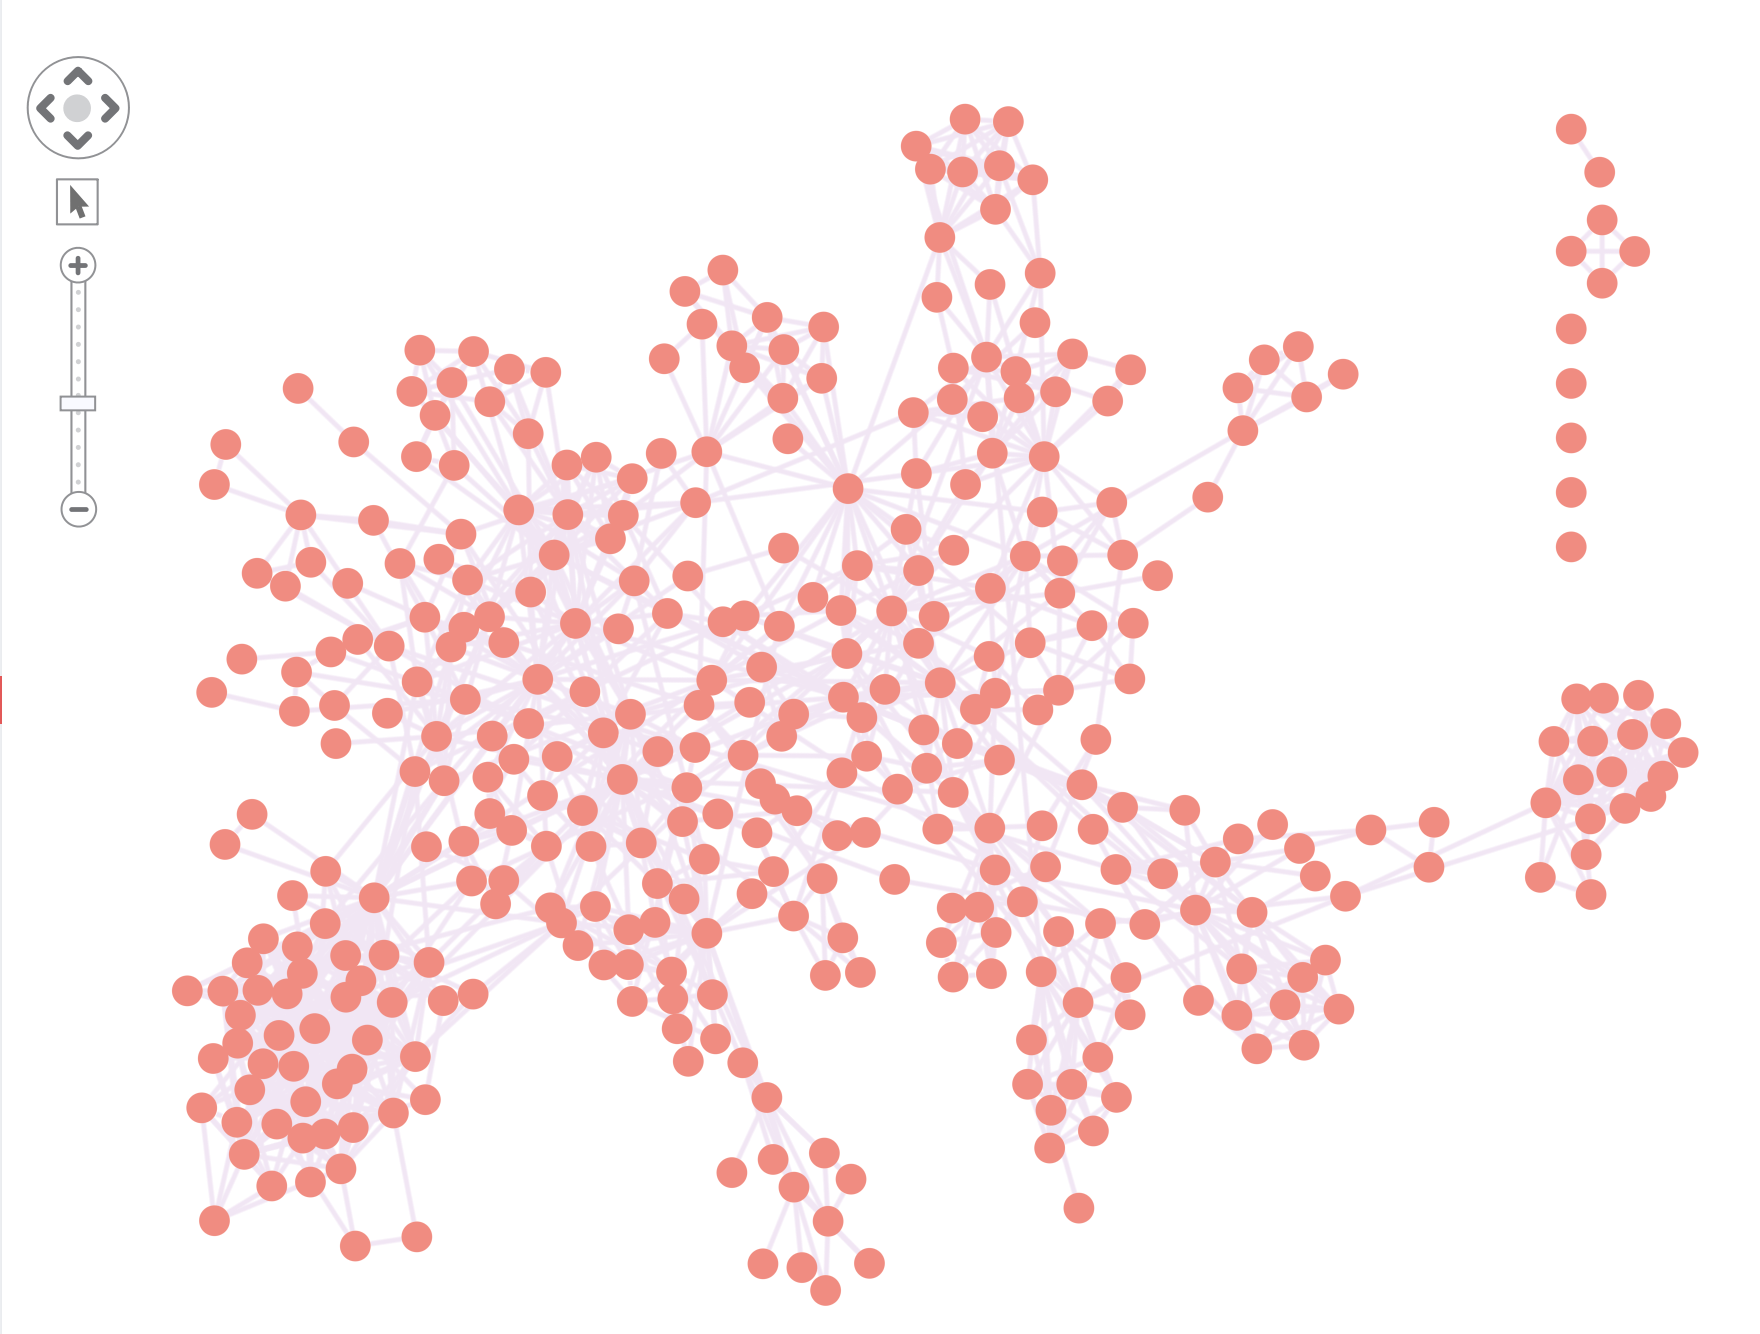
In very busy charts with lots of nodes and links, it’s hard to differentiate between what’s important and what’s not.
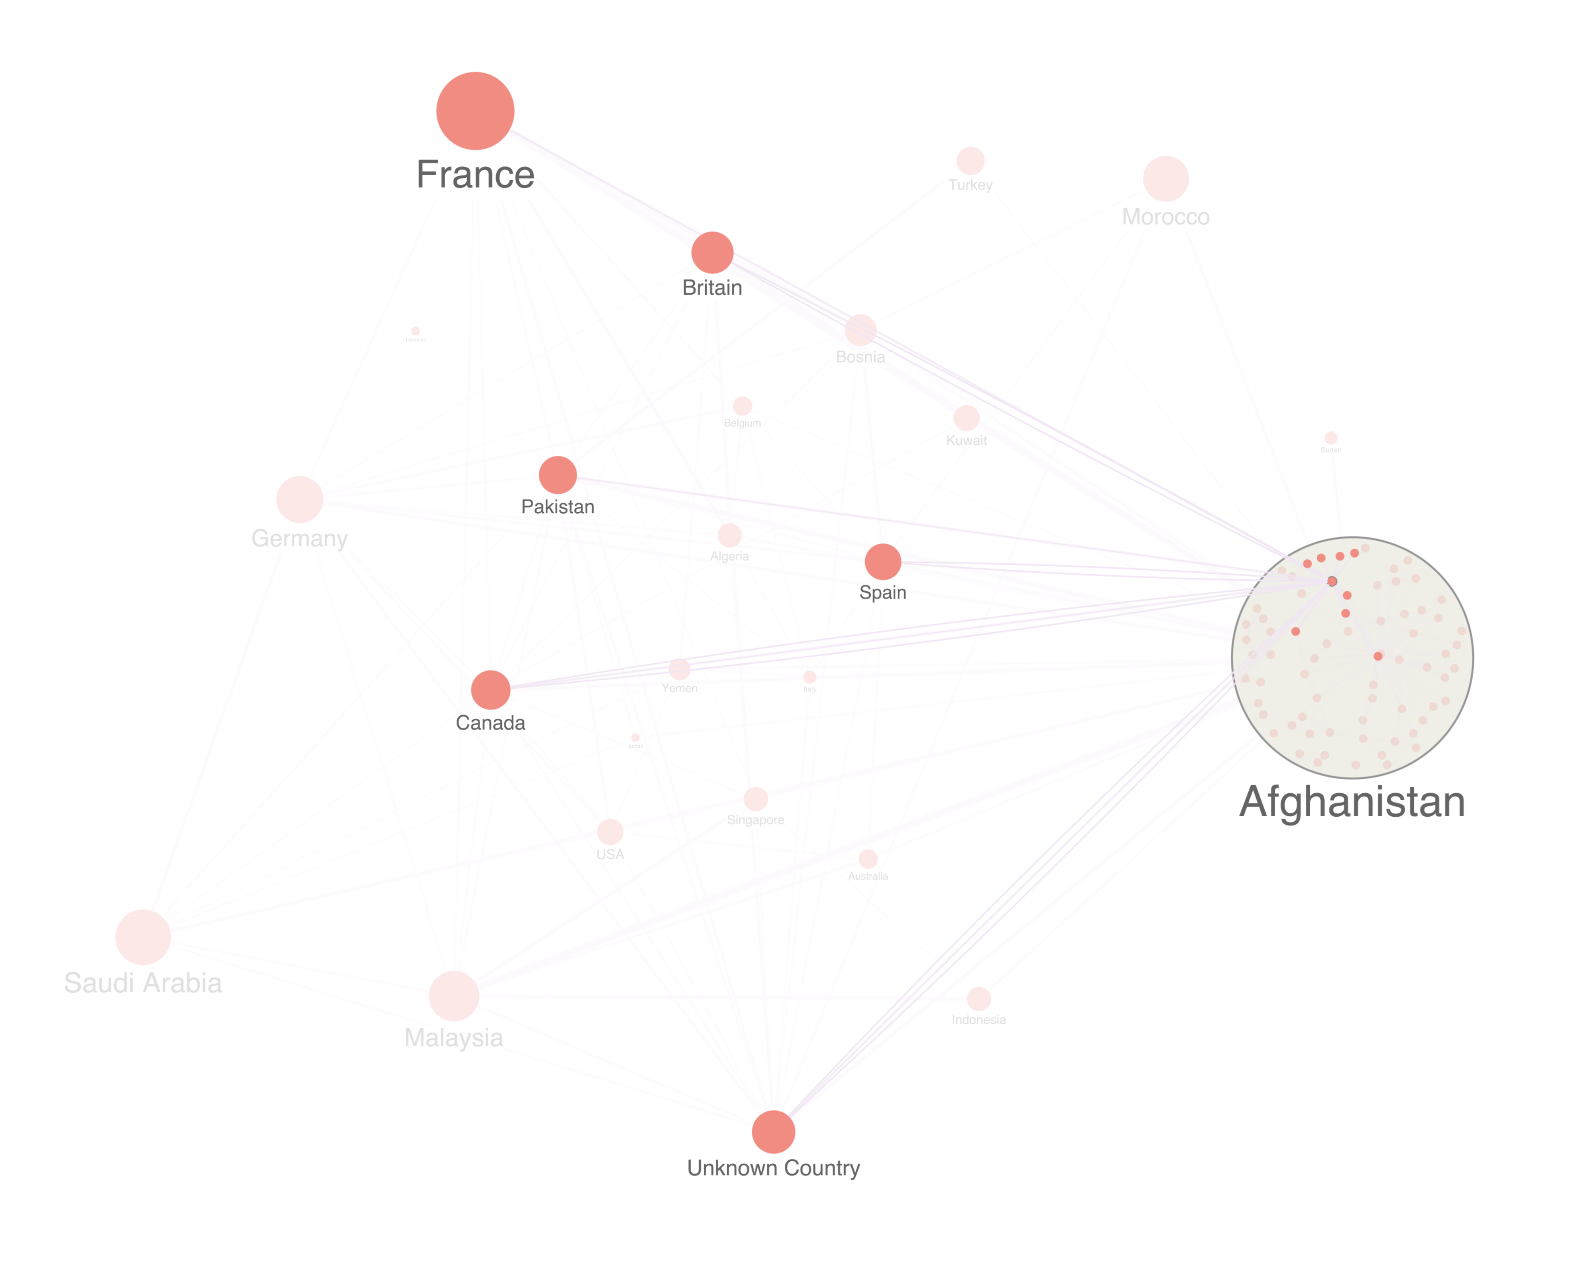
The smart way to reduce the number of items is to group together nodes with similar properties. We call these combined nodes combos. For example, our dataset contains the country of origin for each terrorist suspect. Grouping suspects by country gives us a beautifully clean high-level view of the data:
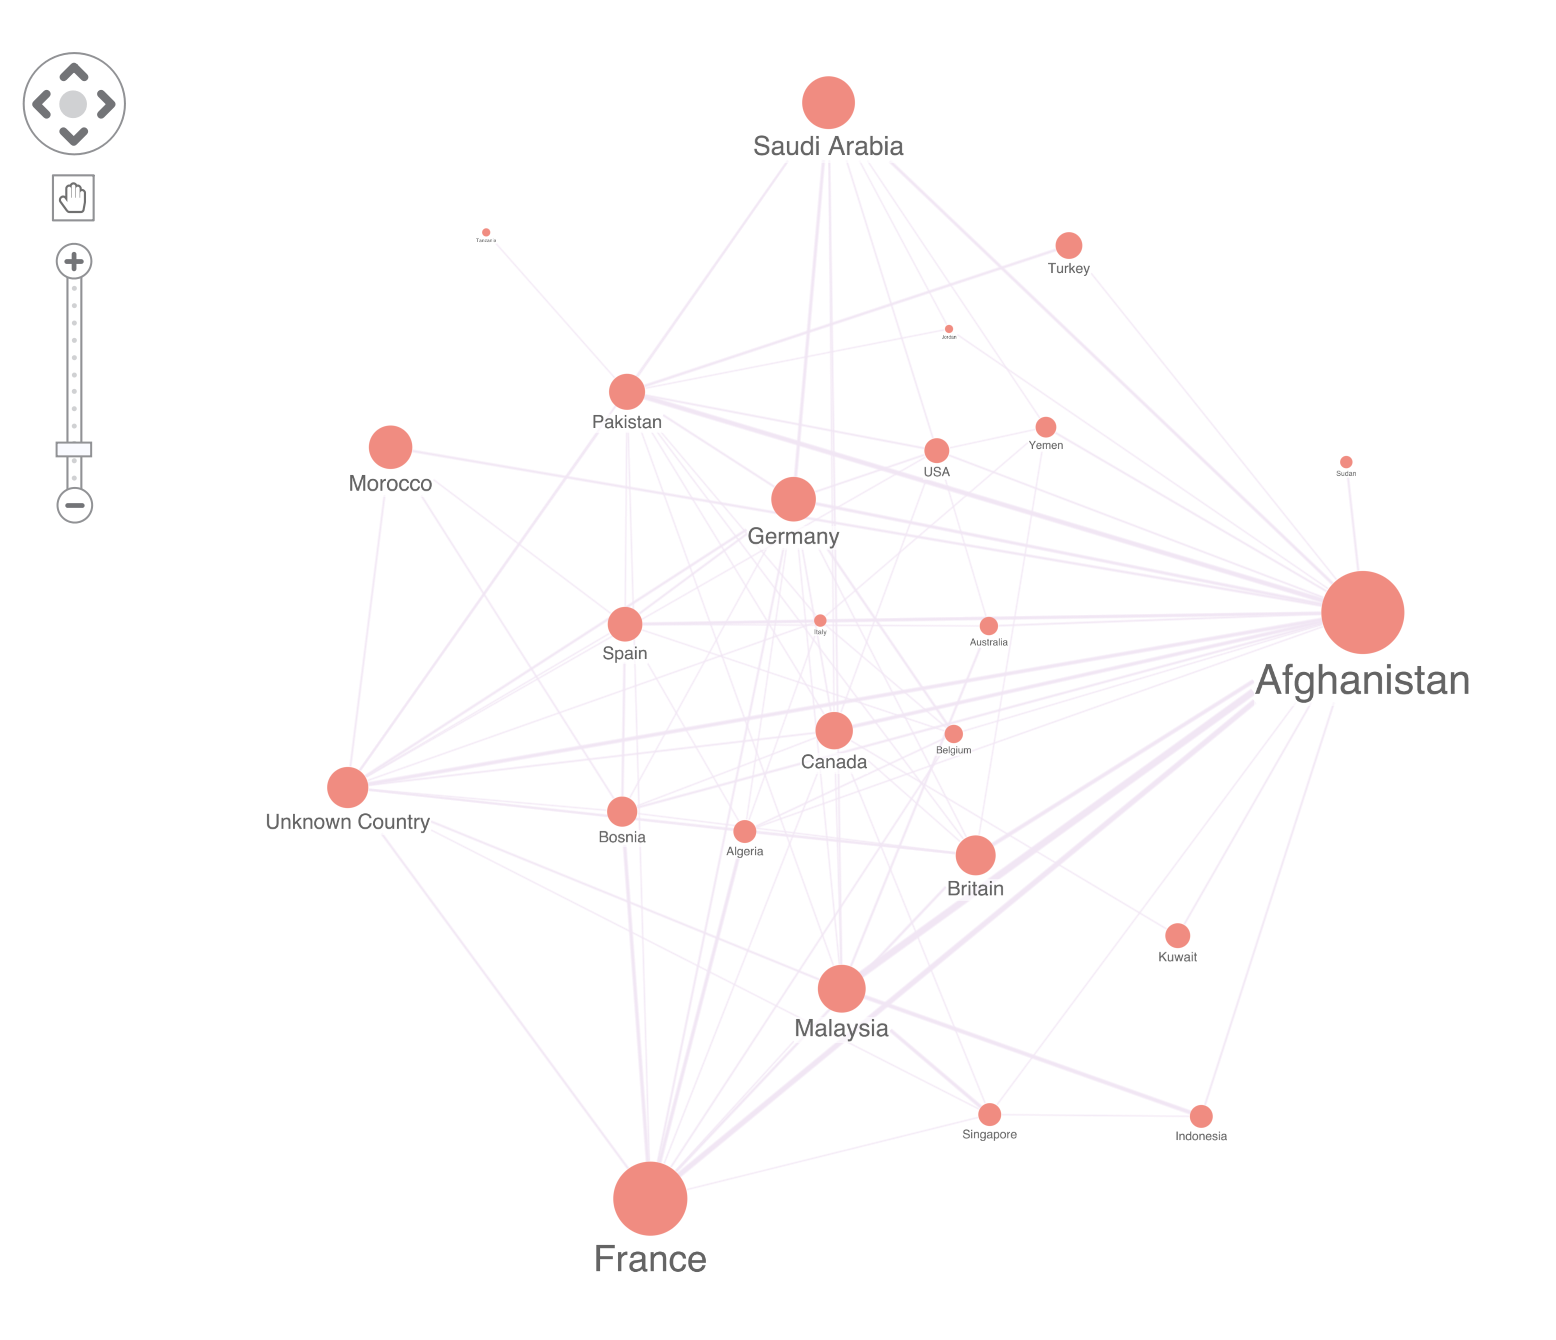
Notice how ReGraph automatically combines multiple links between nodes into a single link between combos.
Creating combos in ReGraph is really straightforward. You just set the combine prop to tell ReGraph which data properties to use for grouping. Setting the level property will enable or disable combos:
<Chart
  items={items}
  combine={{properties: [‘country’], level: 1}}
/>
We can still drill down into the detail when we need it by “opening” each combo to show what’s inside. If there’s a specific node worth investigating further, we can easily highlight the nodes and combos its connected to.
Sizing nodes by SNA centrality
Graph theory provides a number of ways to assess the importance of each node, which ReGraph exposes as a number of social network analysis (SNA) functions.
Analyzing social connections in any network can reveal important information about information flow, hidden subnetworks, dependencies, and influential nodes.
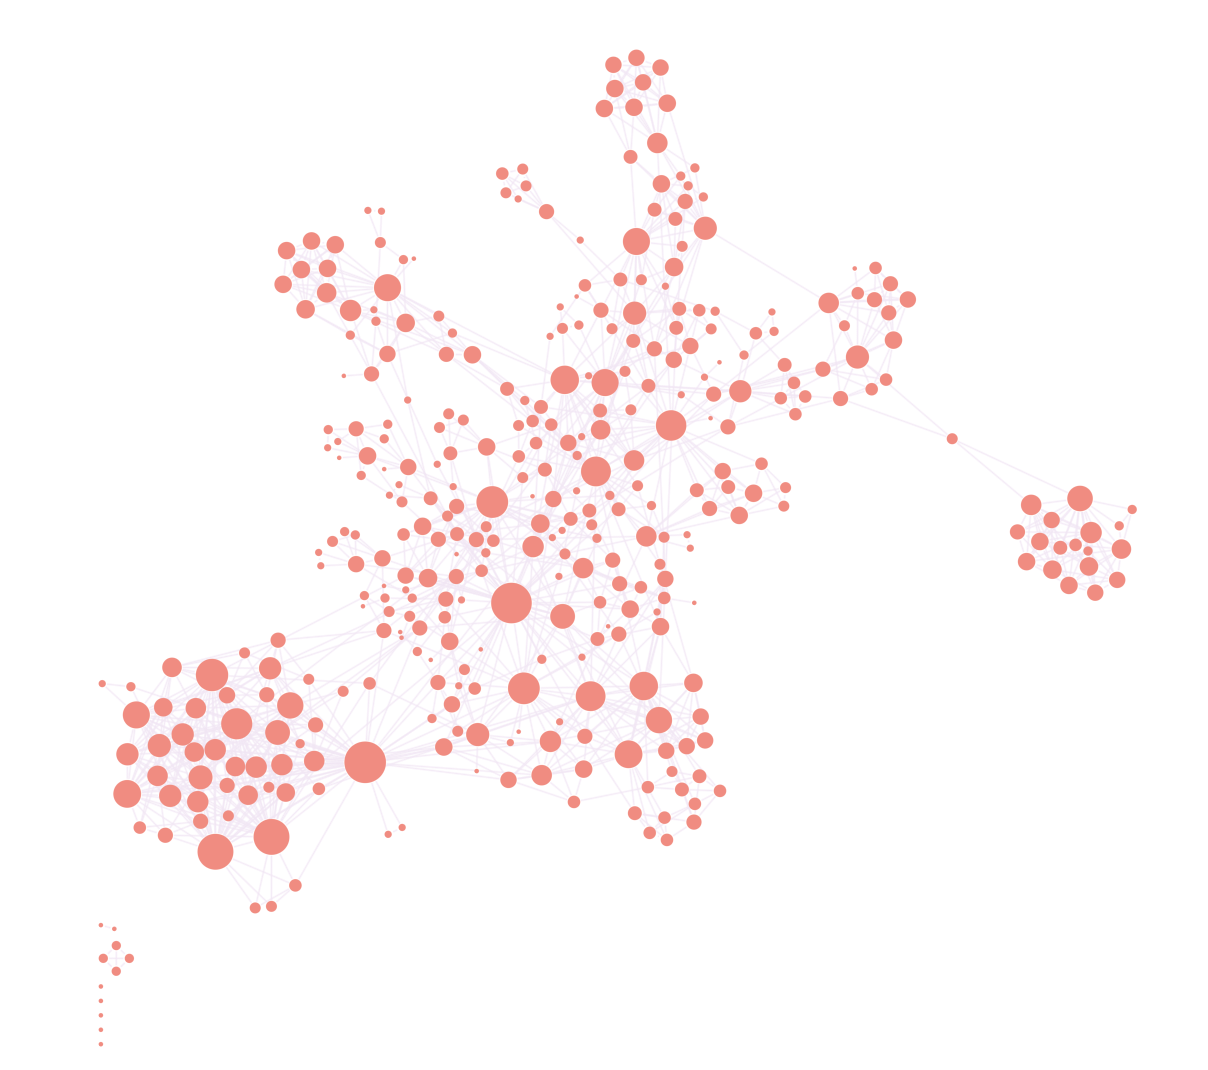
An effective way to make highly-connected nodes stand out is by making them larger. Here, we’ve counted how many connections each terrorist suspect has and sized them accordingly:
To do this in ReGraph, we just import the degrees analysis function, pass in our items, and use that information to set the size of each node:
import { degrees } from ‘regraph/analysis’;

...

const { items } = this.state;
const newItems = Object.assign({}, items);
const scores = await degrees(items);
Object.entries(scores, ([id, score]) => {
   Object.assign(newItems[id], { size: Math.sqrt(score) });
});
this.setState({ items: newItems });
ReGraph supports other powerful SNA centrality measures too, including betweenness to find the ‘gatekeepers’ in a network, and closeness to identify how easily a node can reach the rest of the network.
All these measures are available through function calls with simple APIs – very similar to the example above – so experimenting with them is easy. The ReGraph SDK also features interactive examples of centrality measures to show how they reveal different insights from your data.
For more details on these and the other centrality measures ReGraph supports, see Social Network Analysis.
Are you ready for ReGraph?
We’ve shown how quickly you can get ReGraph working with your React application and start visualizing your most complex datasets. We’ve also demonstrated how easy it is to work with some key features of our advanced graph visualization technology, but there are plenty more features to explore.
This is just a taste of the capabilities of graph visualization with React and ReGraph. If you’re hungry for more, please request a free ReGraph trial.
Share:
