
The 8 biggest challenges in the tech industry in 2023
Christian Miles VP of Sales
29th March, 2023 | 13 min read
If I were to write about every challenge facing senior managers in the tech industry right now, this article would...
Visualizing Microsoft Azure Cosmos DB with our SDKs
Christian Miles VP of Sales
7th February, 2022 | 10 min read
Want to integrate KeyLines or ReGraph with Microsoft Azure Cosmos DB? This developer tutorial gives you full...
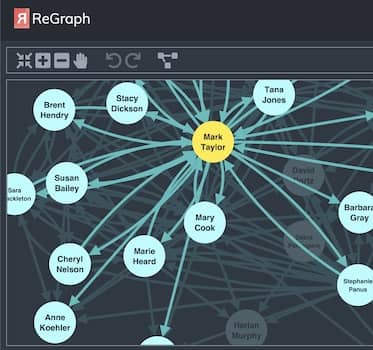
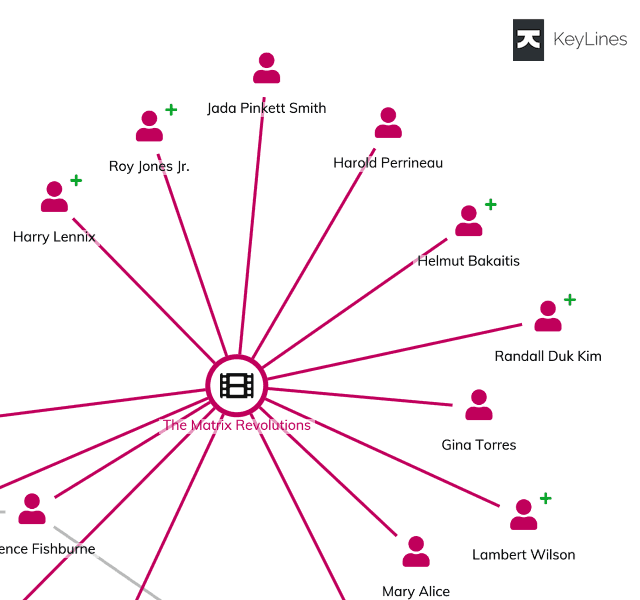
5 essential tips for React developers using ReGraph
Christian Miles VP of Sales
22nd October, 2021 | 11 min read
Discover practical tips for developers using ReGraph, our graph visualization SDK for React, on how to avoid...
React Hooks vs Redux for graph analytics apps
Christian Miles VP of Sales
3rd August, 2021 | 17 min read
This technical article explores the benefits of React Hooks vs Redux for state management. Is there an effective...
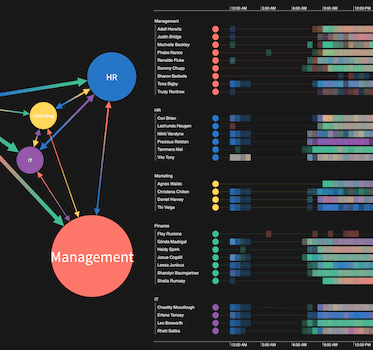
Enhance your dashboard design with data visualization
Christian Miles VP of Sales
6th July, 2021 | 8 min read
Let’s make our visual network analysis tool for dashboards even better! In pt2 of this series, we use...
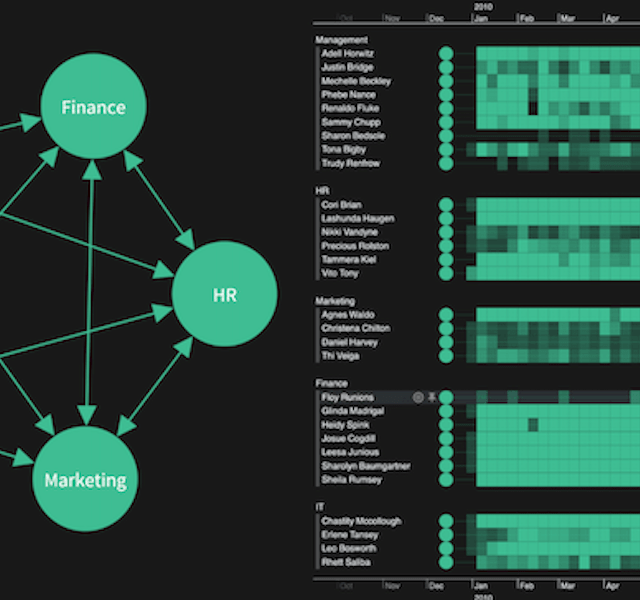
Visual network analysis dashboards that work
Christian Miles VP of Sales
22nd June, 2021 | 8 min read
Let’s explore how visual network analysis tools complement dashboards, adding context, interactivity and...
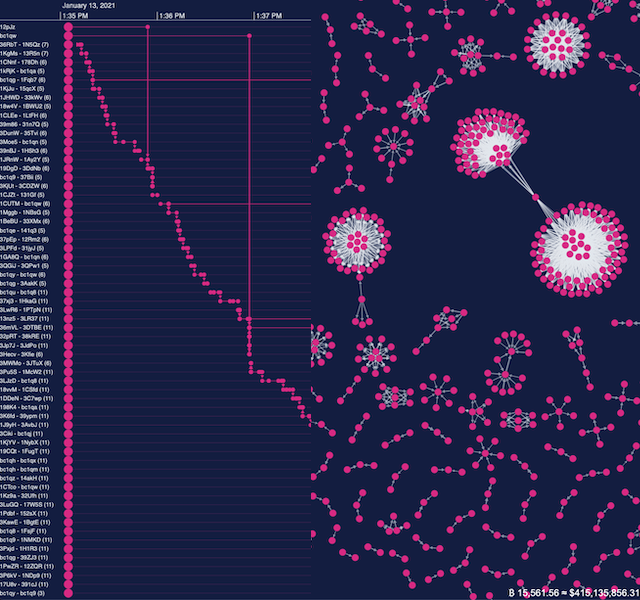
Analyzing cryptocurrency using data visualization
Christian Miles VP of Sales
19th January, 2021 | 10 min read
Find out how to use KeyLines and KronoGraph to create your own live, integrated Bitcoin timeline and chart...
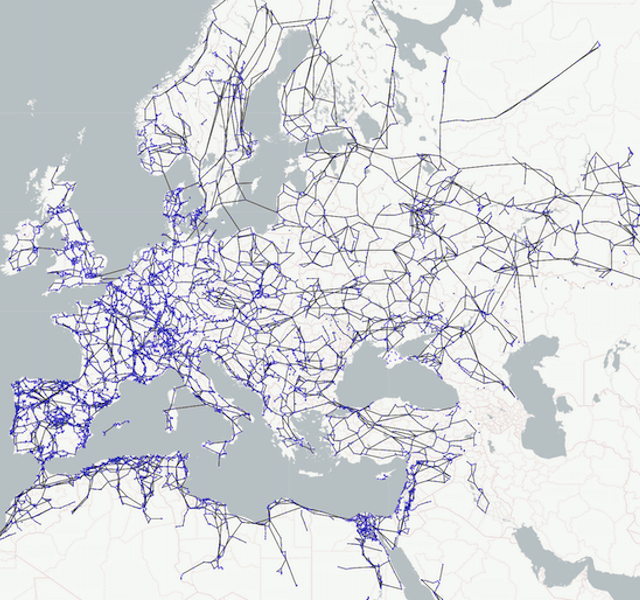
Visualizing network infrastructure with Memgraph & ReGraph
Christian Miles VP of Sales
4th August, 2020 | 11 min read
We explore the fascinating world of energy infrastructure by visualizing the network of energy pipelines routing...
Visualizing the Amazon Neptune database with KeyLines
Christian Miles VP of Sales
17th February, 2020 | 7 min read
This step-by-step developer tutorial describes how to integrate KeyLines with Amazon Neptune using AWS...
