Azure Cosmos DB tutorial for KronoGraph & KeyLines
Ryan Shimmon Commercial Software Developer
14th September, 2025 | 19 min read
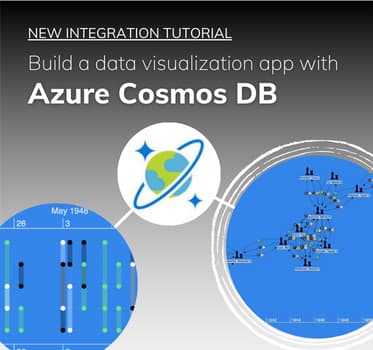
This Azure Cosmos DB tutorial shows you how to build a graph database visualization application using...
Ryan Shimmon Commercial Software Developer
14th September, 2025 | 19 min read
This Azure Cosmos DB tutorial shows you how to build a graph database visualization application using...
Corey Lanum Chief Product Evangelist
14th November, 2023 | 15 min read
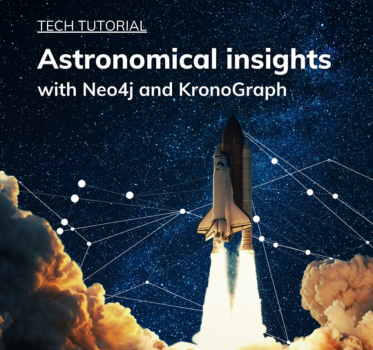
In this tutorial, you’ll find out how to use Neo4j and KronoGraph to create an interactive timeline...
Corey Lanum Chief Product Evangelist
3rd January, 2023 | 15 min read
Follow this tutorial to build an interactive web application – integrated with Amazon Neptune – to...
Thomas Chan Software Developer
25th January, 2022 | 12 min read
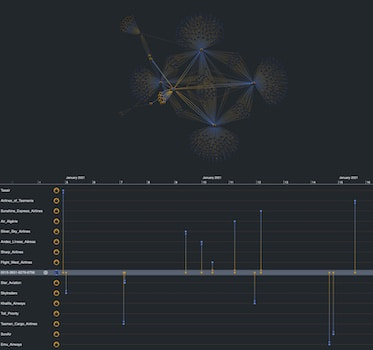
Our updated guide to building a custom root cause analysis timeline and graph visualization app in React, with...
Matt Michel Developer
3rd March, 2021 | 8 min read
Create an interactive React application where Neo4j timeline visualization and graph visualization work...
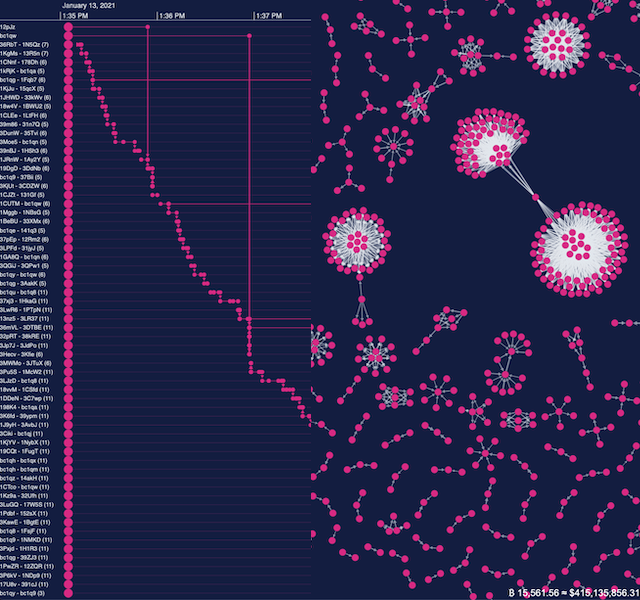
Christian Miles VP of Sales
19th January, 2021 | 10 min read
Find out how to use KeyLines and KronoGraph to create your own live, integrated Bitcoin timeline and chart...
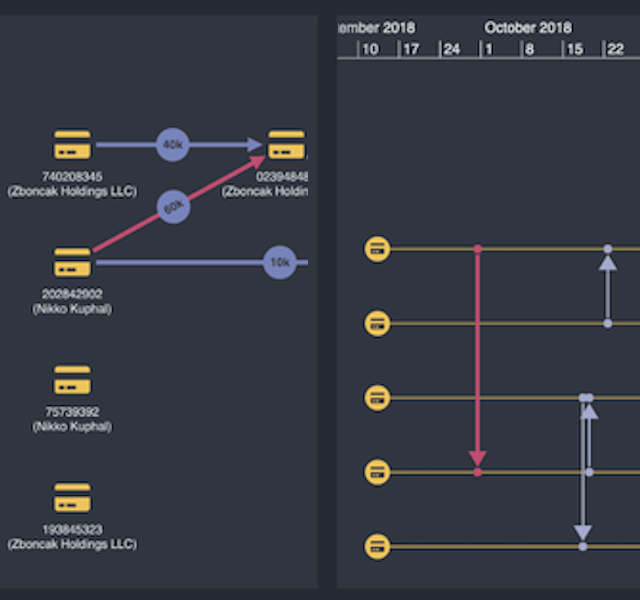
Dan Williams Chief Product Officer
10th November, 2020 | 9 min read
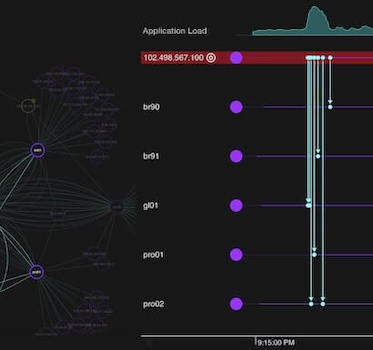
Follow this developer tutorial to build a powerful app for network and time-based data analysis. With detailed...
Dan Williams Chief Product Officer
20th October, 2020 | 5 min read
React devs: find out how quick and easy it is to build a simple React application using KronoGraph, our timeline...
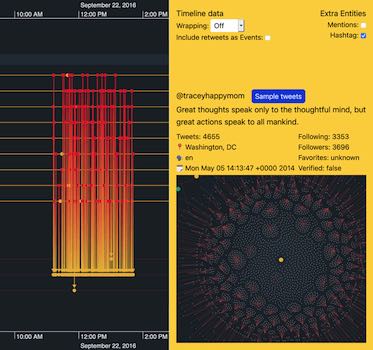
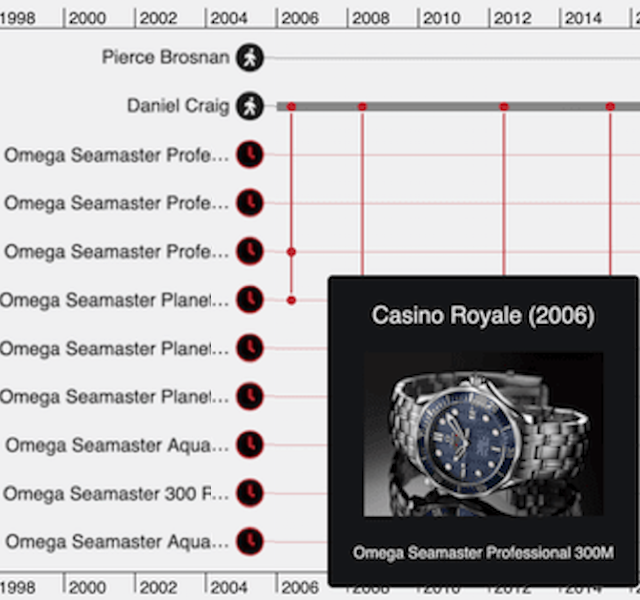
Dan Williams Chief Product Officer
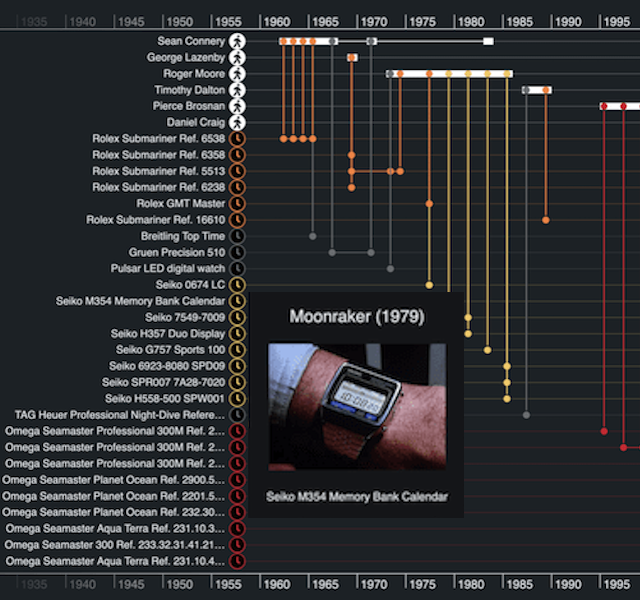
22nd September, 2020 | 7 min read
Follow this tutorial to build KronoGraph timeline visualizations with JavaScript. We’ll also analyze James...
Registered in England and Wales with Company Number 07625370 | VAT Number 113 1740 61
6-8 Hills Road, Cambridge, CB2 1JP. All material © Cambridge Intelligence .
Privacy Policy | Security Framework
