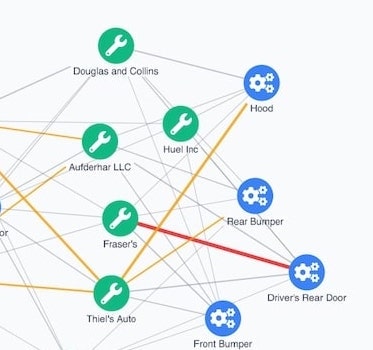
Tailwind CSS tutorial for graph visualization
Ivan Krushkov Commercial Development Lead
16th December, 2025 | 12 min read
In this Tailwind CSS tutorial, we’ll show you how to customize your ReGraph app and achieve the designs you want...
Ivan Krushkov Commercial Development Lead
16th December, 2025 | 12 min read
In this Tailwind CSS tutorial, we’ll show you how to customize your ReGraph app and achieve the designs you want...
Ryan Shimmon Commercial Software Developer
18th November, 2025 | 8 min read
Use the Elastic UI framework (EUI) to build an interactive graph visualization app that looks good and is ready to...
Ryan Shimmon Commercial Software Developer
5th October, 2025 | 9 min read
To build a high-performance, scalable graph visualization application, you need a reliable way to store and query...
Ryan Shimmon Commercial Software Developer
7th September, 2025 | 10 min read
We’ve seen significant interest in TigerGraph’s fast, scalable graph database platform recently. In response,...
Ryan Shimmon Commercial Software Developer
12th August, 2025 | 10 min read
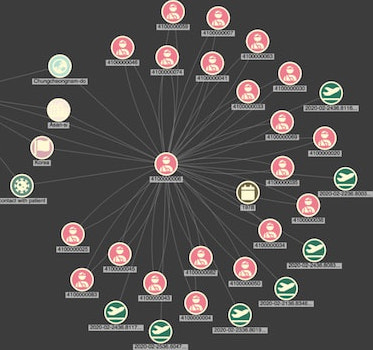
This tutorial shows how to integrate data visualization with ChatGPT, OpenAI’s large language model (LLM)...
Ryan Shimmon Commercial Software Developer
28th July, 2025 | 10 min read
In this technical post, Matt from our development team shares one of the ways he uses React Hooks to produce...
Ryan Hamilton Client-facing Developer
31st March, 2025 | 11 min read
We walk you through how to build a cloud security application that leverages an integration between Google...
Kevin Naughten Senior Product Manager
14th March, 2023 | 7 min read
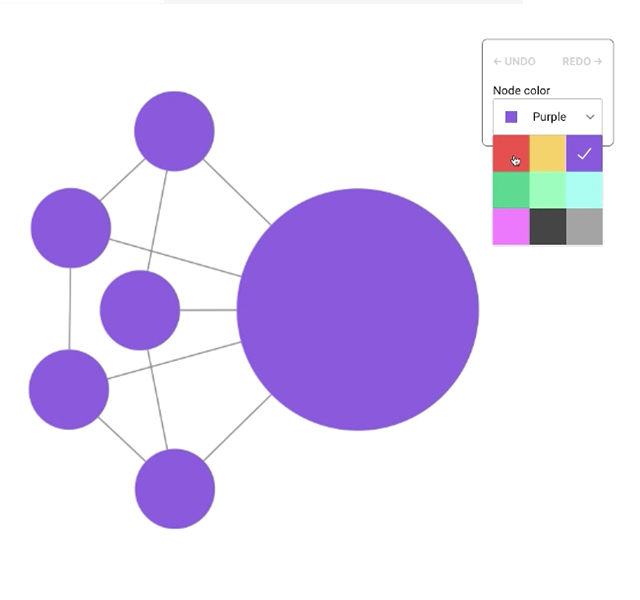
We demonstrate some of the game-changing customization features available in the latest updates to our graph...
Corey Lanum Chief Product Evangelist
3rd January, 2023 | 15 min read
Follow this tutorial to build an interactive web application – integrated with Amazon Neptune – to...
Registered in England and Wales with Company Number 07625370 | VAT Number 113 1740 61
6-8 Hills Road, Cambridge, CB2 1JP. All material © Cambridge Intelligence .
Privacy Policy | Security Framework
