
This tutorial shows how to integrate data visualization with ChatGPT, OpenAI’s large language model (LLM) chatbot. We’ll integrate this AI technology with ReGraph, our React graph visualization toolkit.
You might be fully embracing AI right now or dreading its march towards world domination. Whichever camp you’re in, here’s a quick and easy guide to bringing the power of AI to your users through graph visualization.
Why use data visualization with ChatGPT?
AI models are vastly complex neural networks of data that rely on natural language processing (NLP) to interpret queries and communicate results to users. Think of AI models like ChatGPT and Bard as huge graphs created in real time, where each link is a probabilistic decision to continue a conversation with a new token.
If you’re using technology to visualize knowledge graphs already, this probably sounds familiar. A knowledge graph takes information from different sources and integrates it into a single, large network. That network contains a semantic model of the data for users to query and explore, transforming raw data into knowledge. Visualization makes that knowledge easy to understand and access.
For some years now, we’ve worked with customers who’ve harnessed the power of AI with graph analytics to create successful AI and data visualization products. Read our case studies on graph-powered enterprise AI with C3 AI and Traversals: powering the intelligence cycle for business.
I think AI should be treated like any other tool in the suite of technologies we rely on – using data visualization with ChatGPT is no different. With that in mind, I used my Friday Project experimental time to try out OpenAI’s capabilities in combination with our graph visualization libraries. Once integrated with ReGraph, my aim is to see how well ChatGPT interprets and responds to requests to create and style a graph. Can ChatGPT-style queries offer an easy, user-friendly way to interact with the chart?
To demonstrate, we’ll use a basic dataset of airports across the US states and the flight paths between them.
Getting started with OpenAI
OpenAI was an obvious choice. It uses a nice npm package to interact with their ChatGPT endpoint.
My current app uses React, so ReGraph – designed for React developers – was the perfect graph visualization tool. I’ll need to make different data requests, so instead of repeating the code for each endpoint, I simplified things and created a factory function to do most of the heavy lifting:
import { Configuration, OpenAIApi } from 'openai';


const DEFAULT_MODEL = 'gpt-4';


const configuration = new Configuration({
 apiKey: process.env.OPENAI_API_KEY,
});


const openai = new OpenAIApi(configuration);


export default function createEndpoint(systemText: string, model = DEFAULT_MODEL) {
 return async function (req: NextApiRequest, res: NextApiResponse) {


   const command = `${req.body.text} using this data: ${JSON.stringify(req.body.data)}`;


   try {
     const response = await openai.createChatCompletion({
       model: model,
       max_tokens: 2048,
       temperature: 0,
       messages: [
         { role: 'system', content: systemText },
         { role: 'user', content: command },
       ],
     });


     const reply = response.data.choices[0].message;
     res.status(200).json({ result: reply });
   } catch (error) {
     console.error(`Error with OpenAI API request: ${error}`);
     res.status(500).json({
       error: {
         message: 'An error occurred during your request.',
       },
     });
   }
 };
}
Most of this code is option setting and response handling, to make sure the data going back and forth is formed correctly. The key things to notice are:
- the string to send to ChatGPT in the command variable. The first part is the user’s text input command, things like ‘link employees to companies’. The second part is the user’s actual data, which the AI will use to interpret the result.
- The temperature value when we make the request by calling createChatCompletion. This is the level of ‘randomness’ that the AI will use to respond. We want an entirely deterministic and repeatable behavior, so we set this to zero. Each request with identical data produces the same result.
Now, to create the endpoint itself. We feed an ‘initial prompt’ or system text into our endpoint factory to make the endpoint.
Let’s start out with an endpoint to create items from a user’s data. We feed in an initial response that requests a fixed request-response style for the AI to interact within.
import createEndpoint from '../../createGPTEndpoint';


const SYSTEM_TEXT = `You are an intermediary between a human user and
an app used to turn data into graph visualisations. Respond to requests in a JSON format which will
be used to control how the graph is made. Your responses
should be an object with the following properties:


"links": Record<string, { id1: string, id2: string }>
A dictionary of links between nodes, keyed by unique ids


"nodes": Record<string, { label: string; }>
A dictionary of nodes, keyed by unique ids


"success": boolean
A flag indicating if you were able to make a graph


"answer": string
The response which will be displayed to the human user


Your response should be the JSON and no other text.
`;


export default createEndpoint(SYSTEM_TEXT);
We also encode the result into ReGraph format to make life as easy as possible in our response handler.
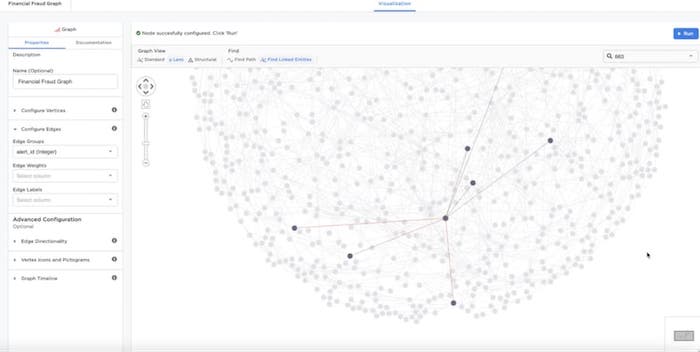
So everything on our endpoints is set up, but when we make a request from a new chat interface, this happens:

Hmm, something went wrong. The server logs tell us that the request failed:
Error with OpenAI API request: Error: Request failed with status code 400
It looks like we’re passing too much data and, to protect the AI, the endpoint throws an error.
This is one of the key issues with AI language models right now. We can only pass a limited amount of data in one request: anything over that is instantly rejected.
It’s hard to predict what the limit is, as OpenAI breaks down words into ‘tokens’ which can vary in length. Look at the tokens created from some of our initial prompt:
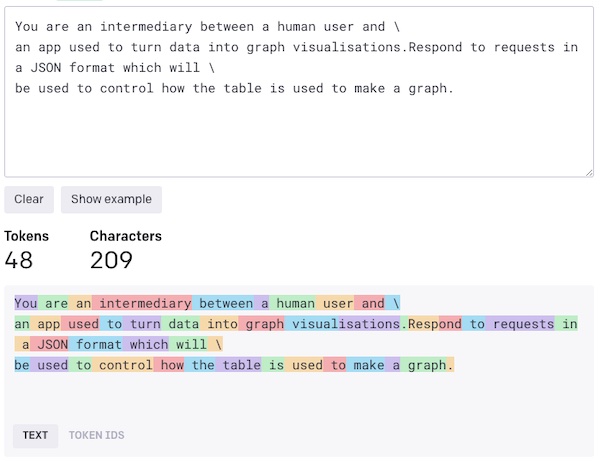
To make sure we send acceptable data, we have to stay under the token limit for both the input and the output.
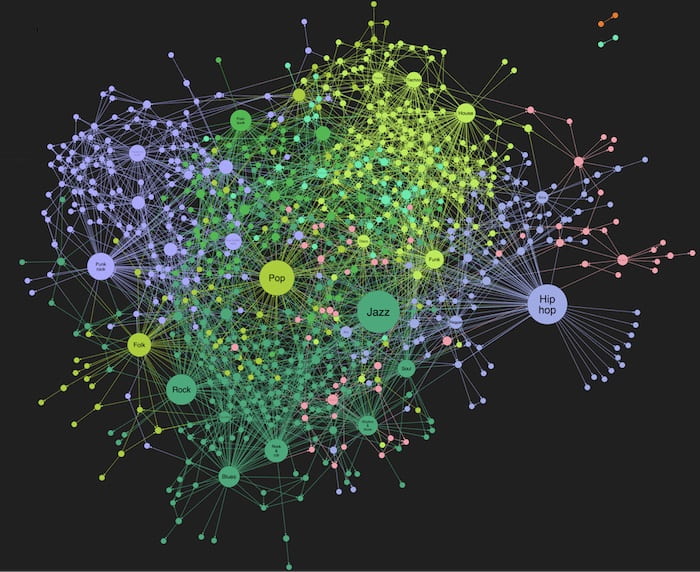
For outputs, we create abstractions to tell the AI to issue commands to a function that will create nodes. This method is more efficient, as it doesn’t require the AI to do the heavy lifting of creating items manually.
Building our AI data visualization
Once we know how to create items to represent our airport data, building them is something conventional code can do for us. Instead of asking the AI for the items themselves, we ask it for an array of id1 and id2 identifiers, which should typically only be about 100 characters long. We can also remove the nodes completely, as we can infer which nodes to create from the link information we get back.
"links": { id1property: string, id2property: string }[]>
An array of properties to create links from
We can do the same for the input data, providing a simpler object that describes metrics and features of the data, such as the locations of potential node id candidates and labels.

This gives us much nicer results. We do the bulk of the mundane, repetitive data processing using conventional code and let the AI focus on what it’s good at: interpreting natural language and converting it to commands for a constrained interface.
Styling the graph using AI
Creating the graph was a relatively straightforward task as we only accepted a very small and simple output. Let’s try something more complex and allow a user to control the graph with natural language text inputs. The list of possible outcomes is much larger as we give users the power to style what items look like in our AI data visualization. That means color, font icons, sizes, and even filters.
We need a new endpoint with a new initial prompt:
import createEndpoint from '../../createGPTEndpoint';


const SYSTEM_TEXT = `You are an intermediary between a human user and
a graph visualisation. Respond to requests in a JSON format which will
be used to control settings of the graph. Your responses
should be an object with the following properties:


itemType: string;
The name of the type of item whose property should be changed. This should be one of the types defined by the user


property: 'size' | 'colorBy' | 'color' | 'icon' | 'filters' | 'label'
The name of the property to change


value: string;
The new value for the property.
"answer": string;
The response text which will be displayed to the human user


"success": boolean
Flag to indicate if a good response was found


Your response should be the JSON and no other text.
`;


export default createEndpoint(SYSTEM_TEXT);
Notice that we’ve reused the original endpoint code with a few small tweaks. It works surprisingly well, particularly for properties like ‘color’, where the AI can leverage its general knowledge of colors to give us sensible values.
We are experiencing the same bandwidth issues as before though: we can’t give the AI the data it needs to return a valid value every time. We can’t summarize it like before either, because there’s no way the AI can know the exact names of our icons in advance, or the list of possible labels. And we can’t fit those options into the token limit.
The solution is to break down our requests into multiple stages, and at each stage ask the AI to request the data it needs for the next stage. In effect, we’ll have a short conversation with the AI about what command we need it to perform. Depending on the response, we then ask what option to pick from a list of possible values or set of rules.
Our main endpoint for graph commands now looks like this:
async function (req: NextApiRequest, res: NextApiResponse) {


  const command = `${req.body.text} using this data: ${JSON.stringify(req.body.data)}`;
  const firstResponse = await fetch('/api/gpt/graph', {
    method: 'POST',
    headers: {
      'Content-Type': 'application/json',
    },
    body: JSON.stringify({
      text: inputText,
      data: `{
        categories: [${Object.keys(entityTypes)}],
        possibleValues: [${Object.keys(columnTypes)}],
      }`,
    }),
  });
  if (firstResponse.status === 200) {
    const command = firstResponse.data.choices[0].message.command;
    const finalResponse = await fetch(`/api/gpt/${command}`, {
      method: 'POST',
      headers: {
        'Content-Type': 'application/json',
      },
      body: JSON.stringify({
        text: inputText,
        data: `{
          values: [${req.body.secondaryData[command]}],
        }`,
      }),
    });
    const reply = finalResponse.data.choices[0].message;
    res.status(200).json({ result: reply });
  }
  res.status(500).json({
    error: {
      message: 'An error occurred during your request.',
    },
  });
}
We make our first request to the main graph endpoint, and then branch off – depending on what the command is – to make our second request to the endpoint that’s primed to handle it. We also include the relevant data for that second request, but exclude the other, now irrelevant data the endpoint was given.
Interestingly, this method increases the reliability and quality of the responses that the AI gives, because irrelevant data is stripped out of subsequent requests. It reduces the likelihood of insignificant input for the current decision polluting the outcome.
Give data visualization with ChatGPT a try
In this experiment, AI did a good job of processing the natural language input into API commands. You can apply this to virtually any form of request as long as you make your response format concise enough.
It’s true, the AI isn’t doing everything for us, but it’s a useful tool to give users a more intuitive and friendly way to interact with advanced graph visualization apps. Why not try data visualization with ChatGPT for yourself?
Share:
