In this blog post, we’ll see how C3 AI – the enterprise AI pioneers – uses graph and timeline visualization to help bring automated predictive insights to any industry.
What does C3 AI do?
Did you know that 2.5 trillion megabytes of data is generated each day? Or that 52% of the Fortune 500 companies listed in the year 2000 no longer exist?
Those two facts may seem unrelated, but they’re not. Enterprise data is growing at a dizzying speed. Organizations that can turn their data into something useful will survive. Those that can’t, will disappear.
That’s why C3 AI exists.
Since 2012, the Redwood City-based business has become a world leader in enterprise AI. Organizations like Shell, the US Army and Engie rely on them to deploy AI-derived insights for use cases ranging from supply chains to CRM to fraud detection.
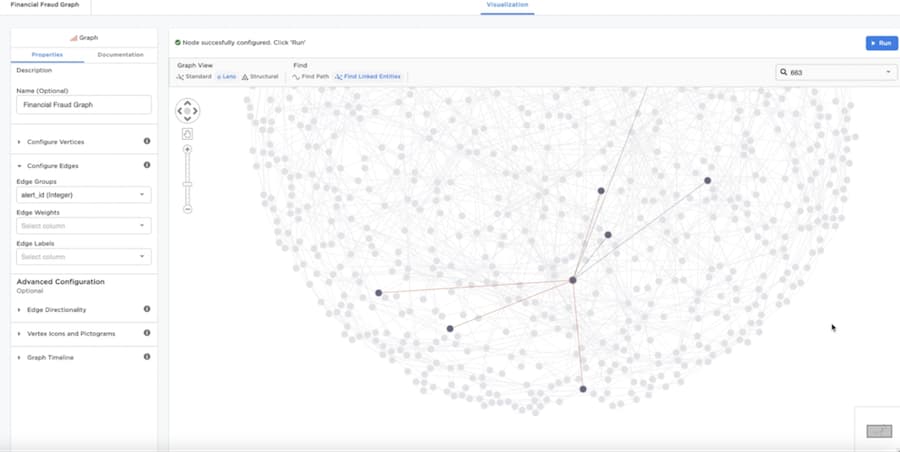
An example of a financial fraud graph, created and visualized in C3 AI Ex-Machina
They’ve created a suite of enterprise AI products, including application development platforms and turnkey tools covering more than 20 different use cases. The result is a comprehensive family of AI software capable of turning huge, complex and varied datasets into valuable insights.
The challenge of enterprise AI projects
Deploying enterprise AI is a massive challenge. Many of C3 AI’s customers attempted to build their own solutions in-house, sometimes two or three times, before turning to the C3 AI stack.
The data involved is huge, complex and multi-layered, requiring a jigsaw-like architecture of interconnected technologies from multiple vendors. To overcome this, C3 AI’s model-driven architecture abstracts away the data and stack complexities, leaving customers free to focus on finding answers rather than figuring out how to ask the questions.
But it still leaves the challenge: how do users make sense of this big, complex, densely connected data? Especially in an environment with endless use cases, data types, data sources, schemas, AI models, questions and potential audiences.
A big part of the answer lies in graph analytics and visualization.
C3 AI’s enterprise AI and graph data visualization
C3 AI invests in advanced graph and timeline visualization technologies, powered by ReGraph and KronoGraph, to help users harness connected data analysis in and alongside their AI workflows.
They’re rolling-out graph components across their portfolio. This means users can harness advanced graph analytics – like centrality analysis, pathfinding and clustering – then interpret and explore their results visually.
Fabien Vives, C3 AI’s Principal Product Manager summarized the role of visualization and data enrichment enterprise integration in their user-centric approach to application design:
“Our products store data, improve it with enrichment, then apply AI models to extract value from it. With graph data visualization, we can summarize the complexity of that process, and encourage users to perform more advanced data exploration workflows.
With interactive visual tools, they can pull the thread of complex problems, unraveling insight as they go to answer more detailed business questions.”
This user-centric approach is important, given C3 AI’s mission to make AI-powered insights available throughout the enterprise. Their audience isn’t just AI-savvy data scientists or developers.
“Most users don’t need – or maybe even want – to become AI or graph experts. They just want to get insight in the most effective way, understand where it came from, and make an informed decision. Graph and timeline visualization is the natural way to present a lot of this information, revealing connections, relationships and sequences. There’s a great visual attraction too – people are drawn to graphs. It’s a rich, intuitive, and interactive format.”
One product already benefitting from this interactive graph and timeline visualization is C3 AI Ex-Machina.
C3 AI Ex-Machina – AI-driven analysis for citizen data scientists
C3 AI Ex-Machina is just one product getting a graph visualization enhancement. It’s a no-code/low-code AI platform, designed for what C3 AI calls “citizen data scientists”.
Josh Przybylko, Director of Product Management at C3 AI, defines citizen data scientists and explains what it is they need:
“Traditional data scientists are an expensive and scarce resource in most businesses. Citizen data scientists are what we call the business analysts working on the front lines. Perhaps fraud investigators, HR specialists and sales analysts: people who need to understand complex data, but more often turn to spreadsheets or BI tools, limiting them to backward-looking analysis. We want to provide them with more powerful, AI-driven analysis.”
C3 AI Ex-Machina features a visually rich front-end, so users don’t need a Ph.D. to understand AI algorithms running in the background. Instead, they learn as they go through interactive visualization. Through a visual interface, they build and manage sophisticated AI models without writing code.
Step 1: define a data structure
C3 AI Ex-Machina accesses multiple data sources through a collection of connectors, pulling it into a distributed back-end. Users then create data models spanning different sources, adding analysis and AI algorithms by dragging elements onto a canvas.
Here, we’re looking at two CSV files: one of nodes, the other of relationships. Nodes become our vertices, the relationships become the entities. The Page Rank centrality measure then scores entities based on their relative importance:
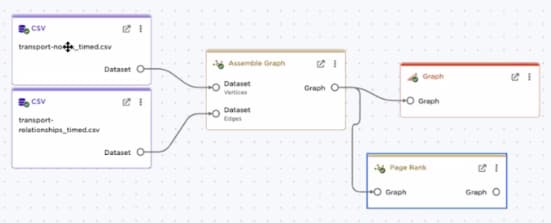
Building a graph data schema in C3 AI Ex-Machina
Step 2: define your analysis and AI methods
Using the same approach, users can run almost any kind of analysis. They can filter based on graph topology (e.g. ‘show me only vertices with more than 3 edges’), run shortest path measures, or apply pre-defined AI algorithms available through a library of templates:
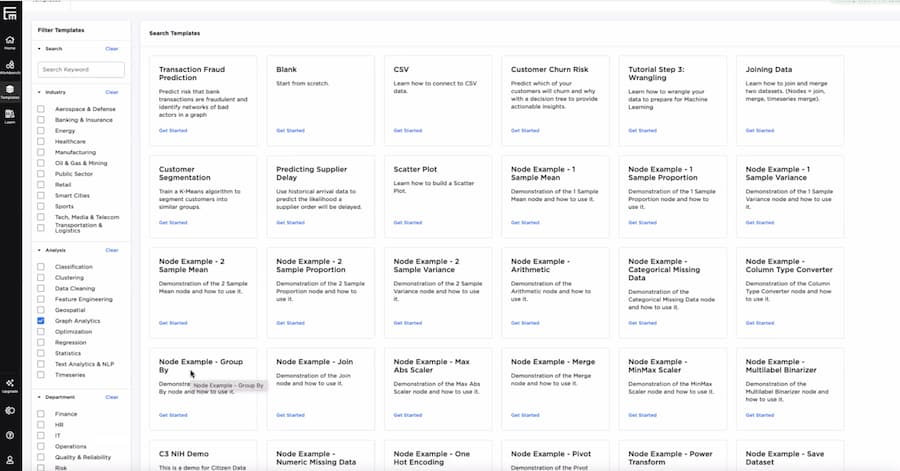
A selection of C3 AI Ex-Machina’s AI algorithm templates
Step 3: visualize time-based connections
Once they’ve constructed their model, it’s just one click to visualize the results in a familiar ReGraph visualization chart:
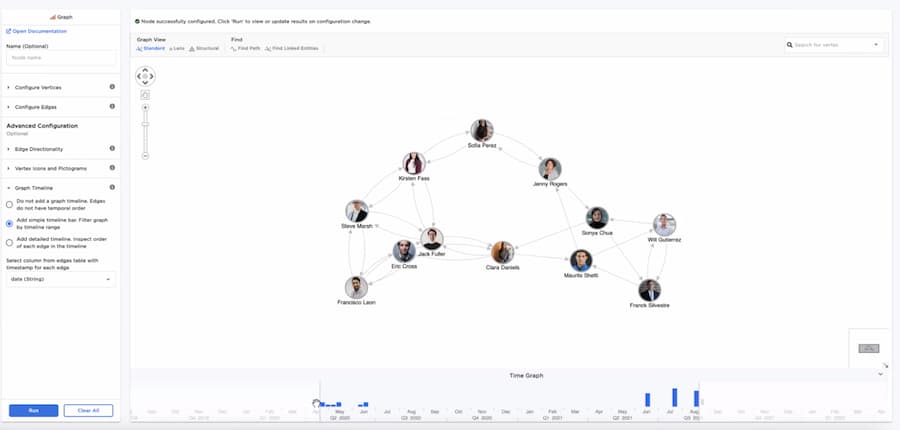
Visualizing the graph in a ReGraph chart
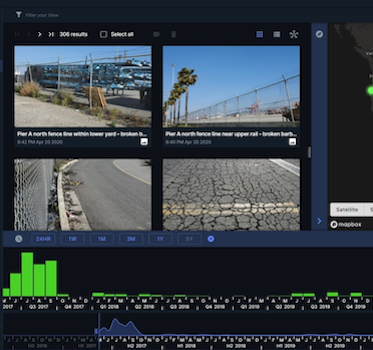
The time bar along the bottom of the chart shows the patterns of activity in the graph, but we can dig into more detail using a KronoGraph timeline:
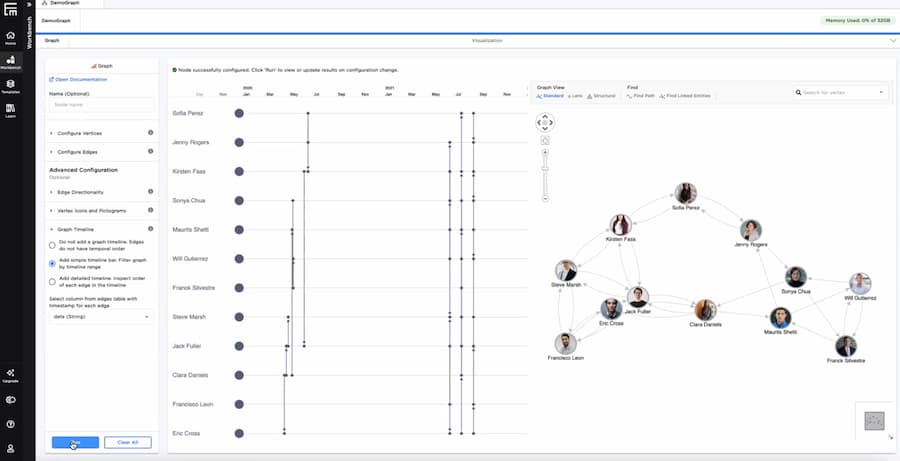
Exploring temporal patterns with a KronoGraph-powered timeline visualization
Explaining complex AI insights with visualization
Explainability is important too. Even the most independent of unsupervised algorithms need some human oversight. Josh Przybylko tells us why:
“We think a lot about “the evidence package” in our products. We don’t just want to present answers in isolation or assign a score without context. We need to show where that score came from. Graphs and timelines help us do that.”
One example is unsupervised clustering algorithms. This is when users rely on AI to group data entities based on characteristics or attributes. It’s a handy way to find correlations that they’d otherwise miss, but unless the analyst understands the differences between the clusters, they’re unlikely to trust the results.
In this example, ReGraph’s sequential layout creates a ‘surrogate decision tree’, outlining how the algorithm arrived as a particular decision:
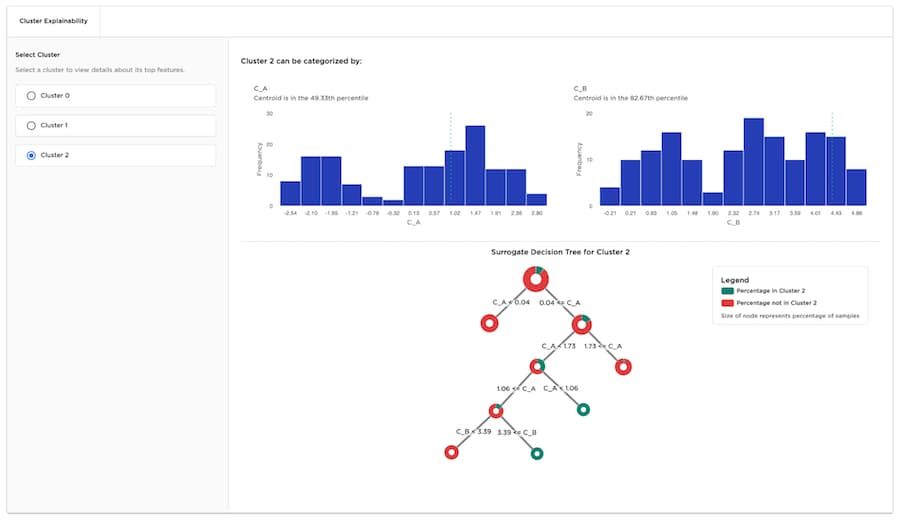
A surrogate decision tree, visualized with the ReGraph sequential layout in C3 AI Ex-Machina
With this level of detail, they can share the results with confidence and use their insight to suggest more effective business changes.
Next steps for C3 AI and data visualization features
It’s still early days for C3 AI’s graph and timeline implementation. The plan is to expand on the functionality to create more advanced and powerful visualizations across their product line.
But their early experience so far has been great. Josh Przybylko, again:
“Our developers love the toolkits so far. They’ve found them to be really reliable and powerful. The SDKs are well documented and informative, with great functionality that our users are going to find invaluable.”
Try it for yourself
Learn more about C3 AI, and its family of enterprise AI products, at c3.ai. Want to try ReGraph or KronoGraph for yourself? Request a trial.
FREE: Graph visualization and artificial intelligence white paper
Find out how successful businesses work with the latest graph visualization and AI technologies to make fast, business-critical decisions.
Share: