
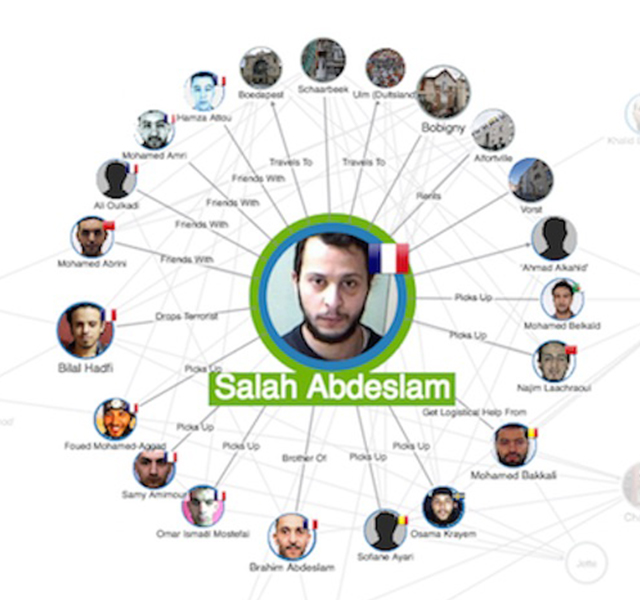
Unlocking OSINT’s potential with visual link analysis
Andrew Disney Marketing Director
6th December, 2024 | 2 min read
Open-source intelligence – or OSINT – is the cornerstone of modern economic crime investigations....
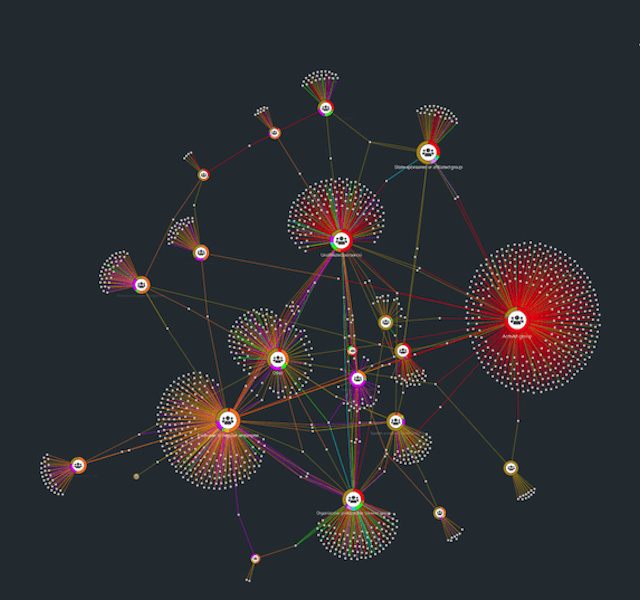
Graph visualization use cases
Andrew Disney Marketing Director
12th May, 2024 | 11 min read
We explore the top real-world data visualization use cases, starting with law enforcement and fraud...
Automatic graph layouts
Andrew Disney Marketing Director
24th February, 2024 | 8 min read
The basic aim of graph visualization is to help users understand their connected data and find actionable insight....

Data visualization, AI and fraud detection
Andrew Disney Marketing Director
30th January, 2024 | 8 min read
Enterprise fraud management, powered by the visualization-AI intelligence cycle from fraud detection to...

Joining forces with Sistemi & Automazione to boost analysis at Italy’s central bank
Andrew Disney Marketing Director
13th November, 2023 | 2 min read
Together with our partners at Sistemi & Automazione, we’ve secured a tender to provide Italy’s central...
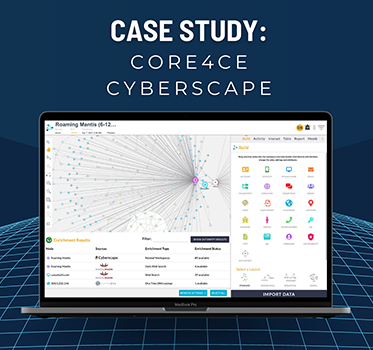
How one customer simplified the US government’s cyber forensics
Andrew Disney Marketing Director
21st June, 2023 | 6 min read
See how Core4ce use KeyLines-powered visualizations to help keep critical systems safe from cyber...
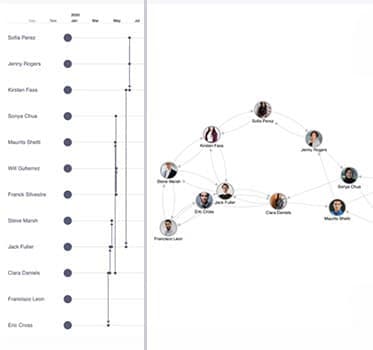
C3 AI: Predictive insights with graph-powered enterprise AI
Andrew Disney Marketing Director
5th July, 2022 | 7 min read
In this blog post, we’ll see how C3 AI – the enterprise AI pioneers – uses graph and timeline...
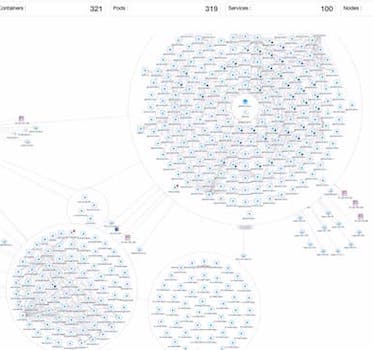
Kubernetes Observability Data Made Clearer with Virtana OpsCruise
Andrew Disney Marketing Director
19th May, 2022 | 6 min read
In this blog post, we see how Virtana OpsCruise – a leading modern applications observability platform and...
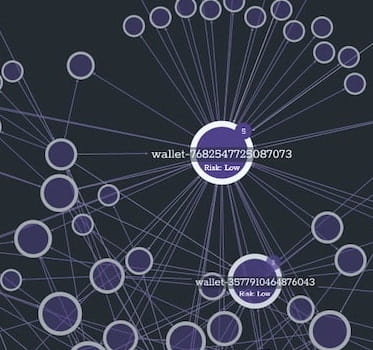
9 techniques for your blockchain analysis tool
Andrew Disney Marketing Director
7th March, 2022 | 8 min read
Follow these techniques to build a blockchain analysis tool and make sense of vast & complex blockchain data...
