Enterprise fraud management (EFM) has changed massively in recent years, with the introduction of AI as a fraud detection tool, and the constant evolution of new AI-powered fraud techniques.
Surging fraud volumes and sophisticated AI tools have changed the dynamics for anti-fraud teams. While it has always been a data-intensive process, enterprise fraud management today is more complex and more important than ever.
In this blog post, we’ll explore the evolving role of AI and data visualization in fraud detection, particularly in the context of enterprise fraud management. We’ll use demos created using our toolkits to showcase the importance of visual data analysis in this area.
What is enterprise fraud management?
EFM is a holistic approach to preventing internal and external fraud, encompassing all aspects of an organization.
Specific strategies and processes differ between industries – fraud risks at a bank are different to an airline or retailer, for example – but they all aim to maximize fraud detection while minimizing disruption to business processes and legitimate customers.
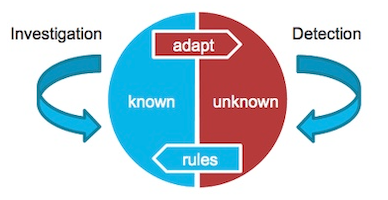
An effective EFM strategy monitors information across silos, and combines data from customers, applications, products and transactions to identify fraudulent activity. In the past, we’ve summarized this using the fraud management cycle, which splits fraud management into two processes:
- investigating familiar fraudulent patterns
- detecting novel fraudulent activity
While this basic model still applies to enterprise fraud management today, the growing adoption of AI as a fraud detection tool is being matched by a rise in new AI-driven techniques for committing fraud. And this has brought a new level of complexity to EFM.
How fraudsters use AI
Research by anti-fraud firm, Sift, points to a 68% increase in scams and spam in the six months since ChatGPT’s initial launch.
Fraud often relies on social engineering, impersonation or brute-force tactics. Generative AI tools can convincingly mimic human communication and behavior, in real time and on a massive scale, so their association with a rise in fraud is no surprise.
For organizations, AI means a greater risk of fraud activity through:
- Automated phishing campaigns, using vast amounts of source material
- More convincing social engineering campaigns
- Synthetic identities based on bot-generated content and imagery, or even deep-fake video
- Credential-stuffing, orchestrated to mimic human activity patterns
Faced with this increased risk, enterprise fraud management platforms are fighting back with integrated automation and AI models.
An AI-powered fight back?
Automation is nothing new in enterprise fraud management. Teams have used rule-scoring and pattern-matching mechanisms for years to identify fraud.
But AI and machine learning has emerged as a game changer for anti-fraud platforms. Implemented well, it identifies complex patterns and subtle signals better than other methods. It also analyzes behavior, biometric profiles and complex patterns at scale, in real-time, 24/7.
Crucially, it also trains itself – constantly updating rules to stop threats faster than standard fraud detection methods.
But there are drawbacks.
For now, a pure AI-driven enterprise fraud management program is an unlikely strategy. While many organizations might want to reduce – or even eliminate – human intervention, ceding control introduces significant risks that need careful management. The biggest problems are:
- A lack of explainability – AI systems can be opaque to fraud teams who need to explain recommendations to customers and stakeholders, document them for compliance, or harness them in prevention activity.
- Reduced visibility of wider threats – trusting AI automation with fraud detection could limit the opportunity to spot emerging trends or patterns which feed into wider prevention programs.
- Potential for mistakes – AI is known to make mistakes and show biases, which can get reinforced and amplified through feedback loops. Human teams need to train systems: they need to understand how and why the tool recommended a course of action before they act on it.
- The human factor – AI is sophisticated, but it’s not yet capable of fully replicating human cognition, or performing the investigation process.
Closing loopholes – AI may detect and block fraudulent activity, but somebody needs to design systems and process changes to close loopholes and remove vulnerabilities.
AI alone is not a replacement for human fraud teams. Machines are great at processing data, finding patterns, applying rules and making recommendations or decisions. But it’s still the role of the human analyst to interpret these recommendations, investigate their accuracy, explain them to others, and ultimately make critical decisions.
The visualization-AI intelligence cycle
Accounting for all this, we can expand on the simple fraud management cycle with a new model that plays to the different strengths of visual analytics, AI and human reasoning. We call it the visualization-AI intelligence cycle:
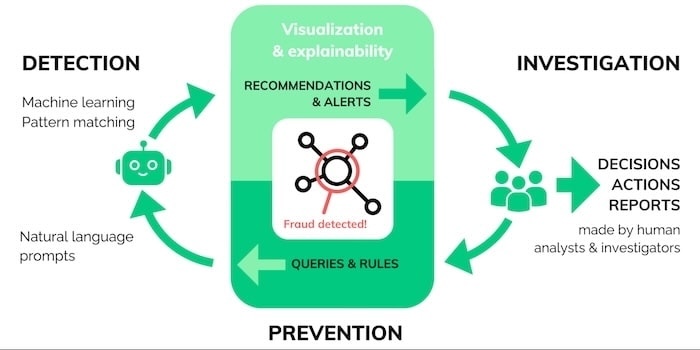
Here, AI reinforces and accelerates enterprise fraud management processes. Each step is backed by powerful visual data analysis that gives teams the insight they need to detect, investigate and prevent fraud.
Let’s take a closer look.
Fraud detection
When an AI tool processes events, there are three possible outcomes:
- Everything seems normal, no action is needed.
- The AI detects fraud, the activity is blocked and flagged.
- The AI is unsure and suspects potential fraud, the activity is flagged for human review.
While machines can handle the first two outcomes well, the third one requires human input. Despite more accurate automation, the increase in scams means more alerts fall into the ‘unsure’ category. No matter how advanced automated fraud detection is already, human teams need to apply their analytical expertise more than ever.
Analysts must review these cases quickly and accurately, often making decisions within minutes. Link and timeline analysis are crucial decision intelligence tools in these situations.
Here’s an example of a medical insurance claim, flagged for investigation by AI.
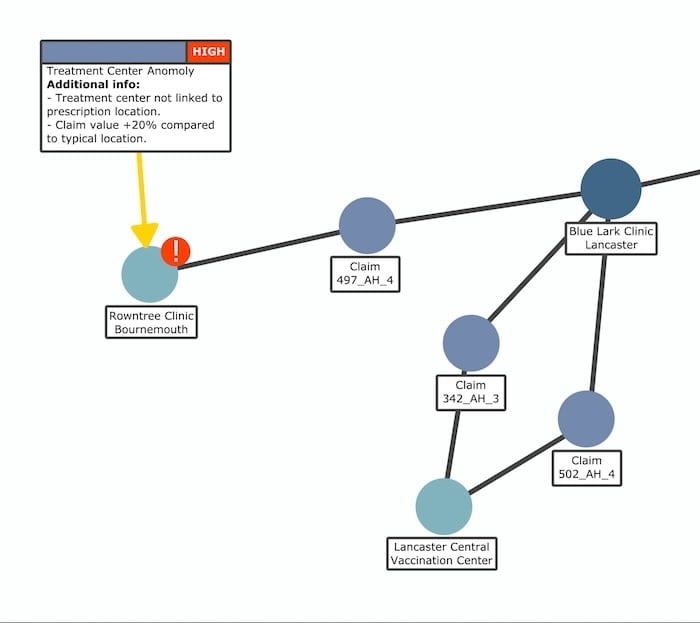
The model compared the claim to others, and flagged two potential issues. Unlike claims 342_AH_3 and 502_AH_4, claim 497_AH_4 is associated with one unusually distant treatment center and was billed at a 20% higher cost than the others.
From here, the analyst can expand out to see other related claims, or plot the data as a timeline to understand the sequence of events involved. We see that prescription P:2284-1fnp2 was double-billed using two different online portals:
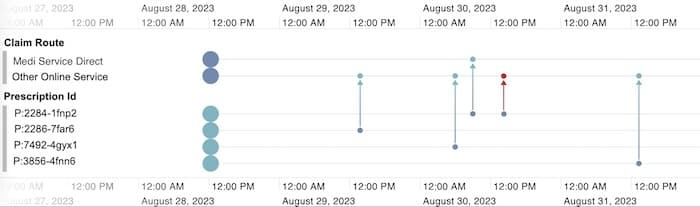
In this scenario, link analysis and timeline visualizations provide a contextual and interactive view of a borderline alert. The analyst can work backwards from a machine-generated output and quickly gets insight into what’s happening. Outputs then feed back into fraud detection models, increasing their future accuracy.
Fraud investigation
More complex cases, think fraud rings and organized criminals, require more complex human involvement. Here, link analysis and timeline visualizations are investigation tools. They present larger volumes of data for investigators to navigate and turn into actionable intelligence.
This fictional dataset shows vehicle insurance claims, with nodes representing policies, policy holders, claims, vehicle damage, doctors, witnesses and mechanics.
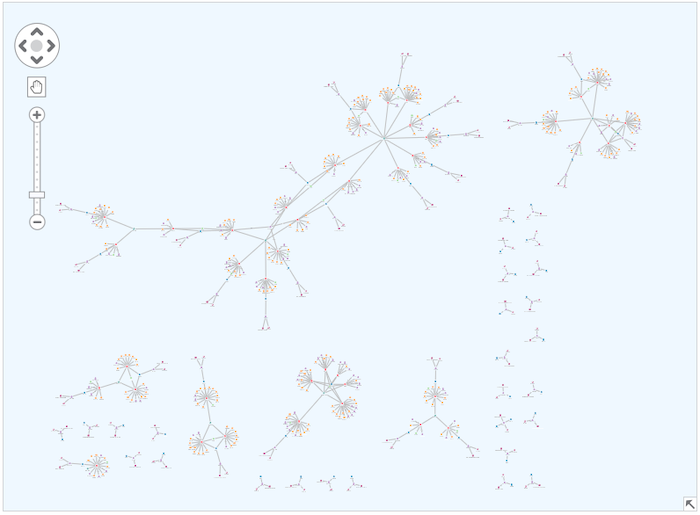
When we visualize the entire dataset, we get a clearer idea of its overall shape. Smaller structures appear to be policies without claims, but there are much more complex structures that need a closer look.
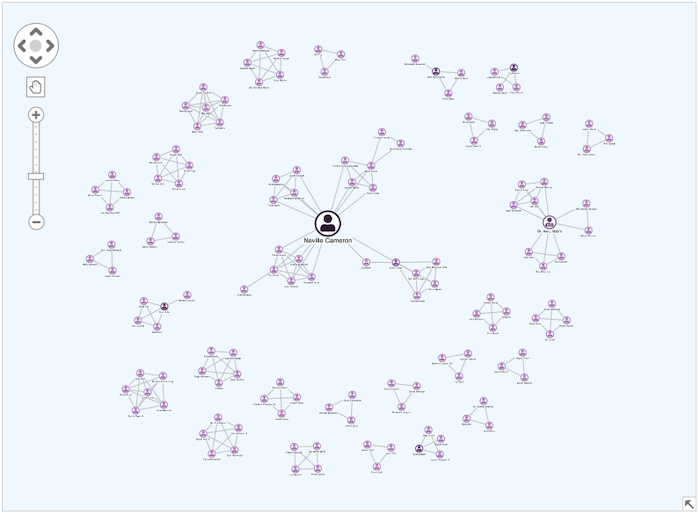
Graph analytics is a powerful way to make sense of this information. Here, we show people who share 1st or 2nd-degree connections through policies and claims. Instantly, one person stands out:
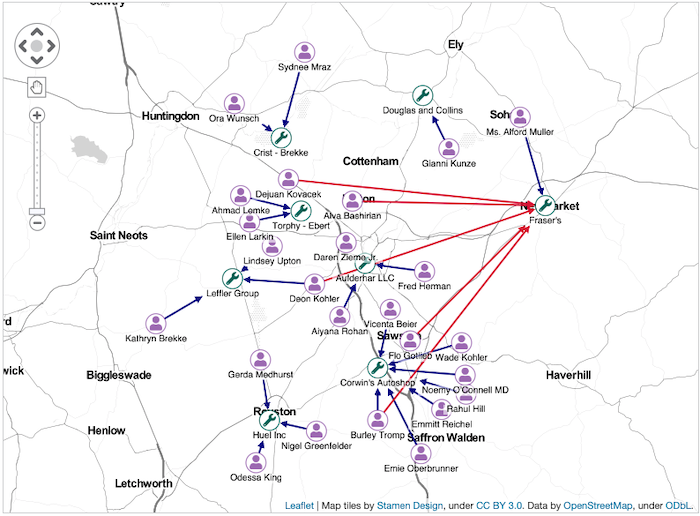
If we plot the same data geographically, we see another pattern – with many of the flagged claims routing through a single mechanic:
In this scenario, visual analytics tools act as investigation boards, simplifying real-world complexity and making anomalies easier to spot. We can then export them, as images or custom PDF reports, ready to document for evidence or a suspicious activity report.
Fraud prevention
The third stage of the visualization-AI intelligence cycle is prevention – where data science teams use new information to train their models. This might include larger-scale data mining to gain insights on wider trends from multiple investigations.
Here, again, visual analytics offer a way to combine data from multiple silos into a single, clear view that makes trends or patterns stand out.
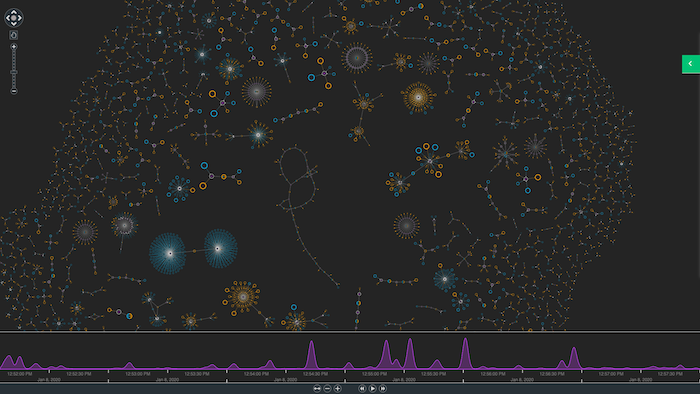
Key analytical capabilities include:
- powerful layouts to untangle dense networks of information
- heatmap timeline views to summarize hundreds of thousands of alerts or events
- combos to group related nodes or events
An increasingly popular approach is to combine large language model (LLMs) into this process, so users can make ChatGPT-style queries to create or interact with a chart:
Supercharge your EFM process with data visualization and AI for fraud detection
Following the visualization-AI intelligence cycle, detection, investigation and prevention become a unified flywheel. Interactive data visualization tools keep fraud management specialists in control throughout, combining the best of machine processing and human cognition.
If you’d like to learn more, our AI + Graph Visualization white paper has more examples of how data visualization and AI technologies work together.
Or, if you want to create your own link analysis and timeline visualization components to supercharge your enterprise fraud management processes, simply request a trial.
This post was originally published some time ago. It’s still popular, so we’ve updated it with fresh content to keep it useful and relevant.
Share:
