
Summary:
This article helps developers evaluate and choose the right graph database for their use case. It breaks down key considerations such as performance, scalability, query capabilities, and data modeling flexibility, while comparing graph databases to relational and other NoSQL approaches. The goal is to give teams a clear framework for selecting technology that supports efficient relationship-driven analysis from the start.
If you’ve found this article, the chances are you:
- Need to build a powerful graph or graph analytics application
- Are debating which is the right datastore for your project
- Want an introduction to the graph database landscape
Over the years we’ve helped thousands of teams visualize their data, working with (probably) every major graph database on the market.
Each has its own strengths and weaknesses, and the best option for you will depend on your specific use case and requirements. That’s why our data visualization SDKs are database agnostic: so you’re free to choose the right stack for your application.
In this post, we’ll take a look at some of the factors you could investigate, and introduce the eight databases our customers work with most often:
Why these eight graph databases?
There have been a lot of new entrants and innovations in the graph database category, with some vendors slowly dipping below the radar, or always staying on the periphery. We’ve focused on the ones we see consistently.
Needless to say, this post isn’t a substitute for your own research. We’ve seen how much effort it is to switch databases mid-project. Investing time to test drive your chosen database – with real data and queries – is key.
What is a graph database?
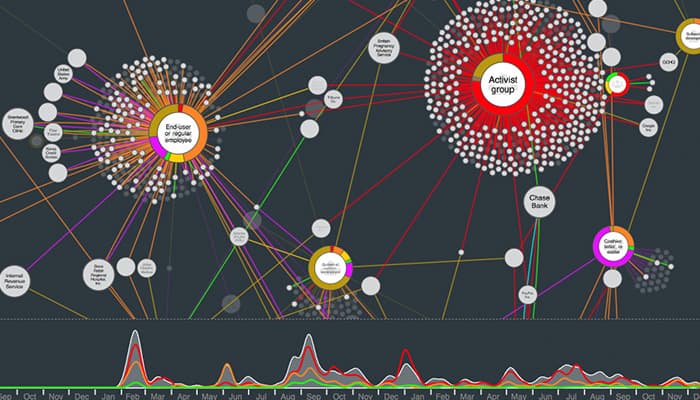
Graph databases are datastores optimized for connected data.
They store information in a graph model, meaning data points can be queried in relation to their connections with other data points. This makes it easier to run complex queries that would be prohibitively slow in traditional databases, and to draw insights from connections between disparate pieces of information.
The list of graph database use cases is long, and growing, including fraud detection, cyber security, network/IT management, knowledge graphs, supply chain and recommendation engines.
Do I need a graph database?
This is the first question you need to ask yourself. Many of our customers successfully build fast and scalable graph visualization applications without a graph database.
The answer probably depends more on the complexity of your queries than the connectedness of your data. Relational databases (with recursive SQL queries), document stores, key-value stores, etc., can handle many graph-type problems. Chances are you already have one in your organization too.
In our experience, graph databases make most sense if you’re running complex analytical or pathfinding queries with 4 or more traversals – that is, 4+ node ‘hops’ from your starting point – or simpler graph queries that require real-time processing.
Graph database factors to consider
Native vs multi-model graph databases
One way to categorize graph databases is by their native or multi-model format.
Native graph databases are ‘graph first’. In other words, they support only the graph model. According to Gartner’s 2022 Market Guide for Graph Database Management, native options “may be more applicable for resource-heavy processing involving real-time calculations, machine learning or even standard queries on graphs that have several billions of nodes and edges”.
Multi-model databases combine graphs with two other NoSQL data models – document and key-value stores. This ‘best of all worlds’ approach can allow for greater flexibility without the risk and complexity of multiple vendors.
RDF vs property graphs
Another way to categorize graph databases is by their data structure. Graph databases broadly store information in one or both of these underlying data models:
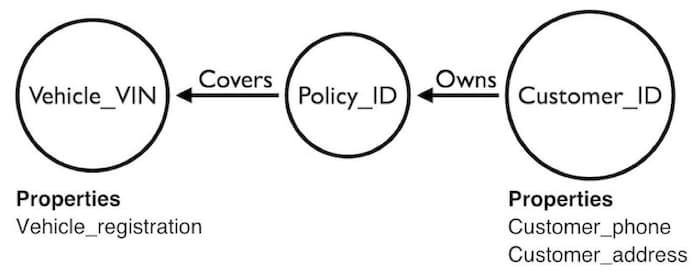
- Property graphs – store information as nodes (entities), edges (connections between entities), and properties, describing the nodes and edges
- RDF graphs – store information using a subject-predicate-object model without properties (e.g. “bank account” – “has” – “warning flag”)
The introduction of RDF-star – an extension to RDF allowing nested triples – has made this distinction less important, but each option has its own strengths.
This blog post from Neo4j gives a comprehensive summary.
Transactional, analytical, or both…?
A third categorization is to think of your use case in terms of transactions or analytics. The abbreviations OLAP (online analytical processing) and OLTP (online transactional processing) might be familiar from other database models. They apply to graphs, too.
- OLTP is the best fit for fraud detection, identity and access management or supply chains – use cases where data is constantly changing, with information getting added, removed and modified in real time. Here, performance for writing to the database is important.
- OLAP is better for complex analysis across a wider, but more static, set of data, like business intelligence and knowledge graph analysis. In these scenarios, being able to issue complex queries matters most.
These two categories are rapidly converging, with most vendors capable of handling both, but different options lean one way or the other. Amazon Neptune’s functionality lends itself more to OLTP, for example, and Neo4j is popular for OLAP use cases.
Graph database scalability
Scalability of graph databases is a remarkably controversial topic, and an area of competitive messaging among vendors.
Storing and querying a small graph is reasonably simple. But once the data scales beyond the capacity of a single server, the graph needs to be distributed across multiple machines. This isn’t ideal given the inherently interconnected nature of a graph – how do you know where to cut?
A common approach is sharding. A single large database is divided, so data is stored across multiple servers, with a virtual server coordinating queries across multiple shards. Spreading the load like this means the system can serve more requests from more users, without slowing performance, but adds complexity for the developer who needs to find the closest thing to a clear break in their data.
This article offers a decent overview of how databases approach the scaling challenge.
Graph database performance
Search HackerNews and you’ll undoubtedly find a benchmarking article for your preferred graph database, together with comments explaining why it should be disregarded.
All database benchmarks are fraught with complexity that limits their usefulness without a specific use case in mind. Results will vary based on:
- The sample data size and complexity – a small topology-only dataset is unlikely to match yours
- The complexity of the query – performance of a 10-hop query is irrelevant if you only need 5
- The database setup – all graph DBMSes need some fine-tuning to get the best performance
- The hardware you use – and your preferred platform will impact overall performance
There are attempts to standardize the graph database benchmarking process. But the only benchmarks that matter are your own. It’s worth taking time to import and query some sample data from your own use case, using the metrics that matter for you.
Query languages
Expressive graph query languages are a big advantage of graph databases. Running graph queries in SQL, while possible, isn’t always simple – especially when building complex queries to join data from multiple source tables. With data stored as a graph, it makes sense to query it as a graph too.
Vendors often support more than one language. Some, like SPARQL, are suited to the RDF format, others are tied to specific databases, like ArangoDB’s AQL. Cypher is Neo4j’s query language but it is supported by other vendors too.
From our experience, the ‘best’ graph query language comes down to personal preference. This blog post by Memgraph gives a good overview of the most popular options.
Functionality
Alongside the criteria above, you’ll no doubt have a checklist of functionality.
There are some key things, like the programming languages, APIs and clients they support, whether they comply with ACID (atomicity, consistency, isolation and durability) principles, and whether they’re hosted locally or via a cloud service.
The indispensable db-engines.com is a great source for that kind of detail.
Eight graph databases that are popular with our customers
Amazon Neptune
“Serverless graph database designed for superior scalability and availability. Amazon Neptune is a fast, reliable, fully managed graph database service that makes it easy to build and run applications that work with highly connected datasets.”
First release: 2017
Format: An open-source, hosted, native, property and RDF graph database
Top 3 advantages:
- Built for cloud – Neptune is fully managed by AWS, meaning you can leave infrastructure challenges, updates, backups and other admin tasks to them.
- Part of AWS – with high availability worldwide and easy integration with the rest of AWS’ products.
- Support for open graph APIs – Neptune offers support for TinkerPop Gremlin, the RDF SPARQL query languages and openCypher.
Visualizing data with Amazon Neptune
ArangoDB
“The database for graph and beyond. ArangoDB is a next-generation graph data and analytics platform that accelerates application innovation and performance to drive faster value creation.”
First release: 2012
Format: An open-source, multi-model (property graph, document and key-value) database with hosted and local options
Top 3 advantages:
- Native multi-model – 3 database models in one, reducing costs of ownership and tech stack complexity. It compares favorably in many benchmarking exercises.
- AQL – the ArangoDB query language is declarative, client-independent, SQL-like, and – unlike others – easy to learn.
- An avocado for every scenario: ArangoBD comes managed or self-managed, and offers an open source community option.
Visualizing data with ArangoDB
Azure Cosmos DB
“A graph database service that can be used to store massive graphs with billions of vertices and edges. With Azure Cosmos DB for Apache Gremlin, you can query the graphs with millisecond latency and evolve the graph structure easily.”
First release: 2014 (of Cosmos DB itself)
Format: A commercial, hosted, multi-model database with a property graph database service via the Gremlin API
Top 3 advantages:
- A Microsoft Azure service – as part of the Azure family, Cosmos DB’s graph capability comes with SLA-backed speed and throughput, access, and 99.999% availability.
- Harness Apache Gremlin – one of the most mature computing frameworks for OLAP and OLTP use cases, and easy integration with other applications and libraries.
- Leave scaling concerns to others – Cosmos DB offers instant elasticity and horizontal scaling without any effort on the developer’s side.
Visualizing data with Cosmos DB
Google Spanner Graph
“Spanner Graph combines purpose-built graph database capabilities with Spanner, which offers industry-leading scalability, availability, and consistency.”
First release: 2024
Format: Multi-model (Relational + Graph)
Top 3 advantages:
- Global scalability – automatically handles sharding and replication, providing horizontal scalability across regions with strong consistency.
- Strong consistency – ensures ACID transactions across globally distributed data, maintaining data integrity.
- Graph capabilities via TinkerPop – Integrates with Apache TinkerPop, enabling graph data modeling and querying using the Gremlin traversal language.
Google Cloud Spanner and ReGraph: how to build a cybersecurity app
JanusGraph
“Distributed, open source, massively scalable graph database. JanusGraph is a scalable graph database optimized for storing and querying graphs containing hundreds of billions of vertices and edges distributed across a multi-machine cluster.”
First release: 2017
Format: an open-source, local, native, property graph database
Top 3 advantages:
- Support for very large graphs – as a fork of Titan, JanusGraph can handle huge datasets using distributed multi-machine clusters.
- Transactional and analytical processing – with graph analytics powered by its Apache Spark integration.
- An Apache 2 license – meaning enterprise and commercial use is free.
Visualizing data with JanusGraph
MarkLogic (owned by Progress)
“Unlock data value, accelerate insightful decisions, and securely achieve data agility with the MarkLogic data platform. Combine your data with everything known about it (metadata) in a single service and reveal smarter decisions faster.”
First release: 2001
Format: Multi-model (Document + Graph + Search)
Top 3 advantages:
- Multi-model data handling – combines document, graph, and search capabilities, allowing for versatile data modeling and querying; strong Geo support.
- Semantic graph support – offers native RDF triple store and SPARQL querying, facilitating complex relationship modeling and inferencing.
- Enterprise-grade features – provides ACID transactions, advanced security, and scalability, suitable for mission-critical applications.
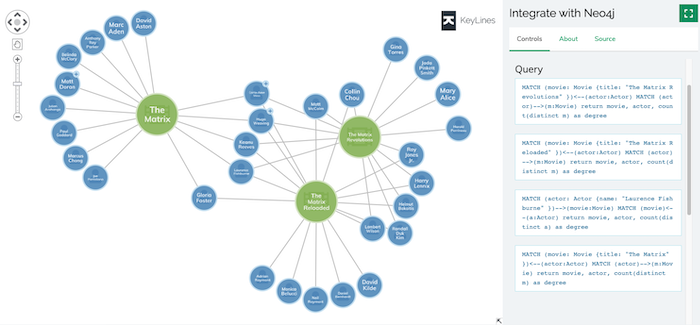
Neo4j
“The fastest path to graph. Neo4j is a high-speed graph database with unbounded scale, security, and data integrity for mission-critical intelligent applications.”
First release: 2007
Format: A native property graph database with hosted (AuraDB) and local versions, including community and enterprise options.
Top 3 advantages:
- The market leader – as the OG graph database, Neo4j has the biggest user base and market visibility by far.
- The gateway graph – with an easy getting-started experience, supported by comprehensive documentation, tutorials and events, Neo4j is a good option for those new to graphs.
- Feature complete – including easy sharding (via composite databases), multiple visualization options, ACID compliance and native support of their own Cypher query language.
TigerGraph
“Enterprise-Scale Graph Designed for Speed and Analytics. TigerGraph is a native parallel graph database purpose-built for loading massive amounts of data (terabytes) in hours and analyzing as many as 10 or more hops deep into relationships in real-time.”
First release: 2017
Format: A commercial, local, labeled-property, native graph database, with freemium options
Top 3 advantages:
- Designed for speed – parallelism is built-in, for super speedy query performance.
- Automated partitioning – data is evenly distributed in a performant and smart way, meaning you don’t need to find a clean break in your graph data.
- No-code migration – from a relational database, with an in-built visualization tool, the GraphStudio, to help build your graph model.
Visualizing data with TigerGraph
When you’ve made your choice
The next step is to build a visual front-end for your shiny new graph database.
If you’re looking for a UI toolkit, designed specifically for graph applications and graph database visualization, we can help – just let us know.
To see how our graph and timeline visualization SDKs work with any of the graph databases mentioned in this post, take a look at our Graph Database Integrations Center.
Key Takeaways:
- Graph databases excel when relationships are central to your data, not just an add-on.
- Query language, performance at scale, and ecosystem support should guide your decision.
- Choosing the wrong data model early can limit future analytics and visualization capabilities.
Share:
