
Visualizing graphs as interactive node-link diagrams is popular for a reason. It’s an incredibly intuitive way to think about graph data, helping users to uncover threats and insights that drive fast, well-informed decisions.
But many people also need to see the time dimension in their data – and they’re finding that traditional node-link visualizations fall short.
In this tutorial, I’ll show how you can achieve a new level of insight using the best graph tools available to us today. Neo4j is one of the most popular graph databases. Combined with KronoGraph, our unique timeline visualization toolkit, it can help you uncover the full story behind your connected data.
Full understanding is just a matter of time…
Graph data changes with time, and every dataset has a time element, even if you think it doesn’t. Communications data has a send date, for instance. And if you’re in cybersecurity, you’ll need to account for packet timestamps and log entry timestamps. Let’s look at an example from the world of finance: a visualization of transactions. We’ll quickly see why a specialized visualization of the time dimension – in this case, transaction dates – is crucial.
Our graph visualization toolkits have a time bar component which helps analysts filter time-based data and understand how networks evolve, but KronoGraph takes time visualization to the next level. It allows you to create interactive timeline charts that illustrate the sequence of events, and the time that elapsed between them.
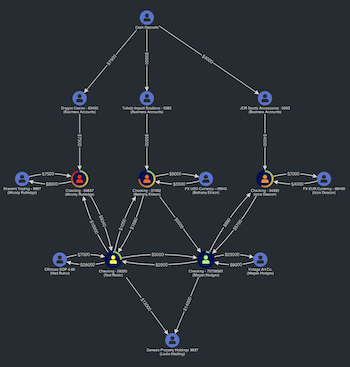
This node-link chart follows a fictitious case of embezzlement at a casino, tracking funds as they flow from business accounts, through various intermediaries, into the embezzlers’ personal accounts.
It’s strongly implied that money flows from the top to the bottom of this diagram – but those transfers into personal accounts could have happened months, or even decades before the transfers out of the business accounts at the top.
The visualization is not only missing the “when”, but also painting a misleading picture. This investigation won’t work without a timeline component…
Discover timeline visualization with KronoGraph
Graph databases treat time as a property that can be stored on the nodes or the edges. KronoGraph exposes this time-based data in a unique way, by creating an entirely new category of visualization: visual timeline analysis.
Our toolkits are all database agnostic, so it’s easy to create a timeline with KronoGraph, and integrate it with any database. If you’re not currently using KronoGraph but you’d like to follow along with this tutorial, simply request a free trial.
Tutorial: Chasing astronauts through time and space
For this tutorial, we’ll use the astronaut database from Supercluster. It lists every human who has ever been to space, starting with Yuri Gagarin in 1961 and ending with the astronauts who are in space right now.
We’ll follow five key steps:
- Load the data into Neo4j
- Build a server-side component to submit Cypher queries
- Build a Neo4j KronoGraph application
- Parse the data getting returned from Neo4j into the KronoGraph format
- Add styling and interactivity
… and then we’ll take a giant leap into our application, and start exploring.
1. Populating our Neo4j graph database
I’m using the managed Aura graph database service here, but you can get the same results with a locally-hosted database.
Once we’ve created a new instance, we’re ready to populate our database.
Our data is in CSV format, not a graph, but Neo4j’s CSV import tool allows us to define the graph model and import the data in a single step:
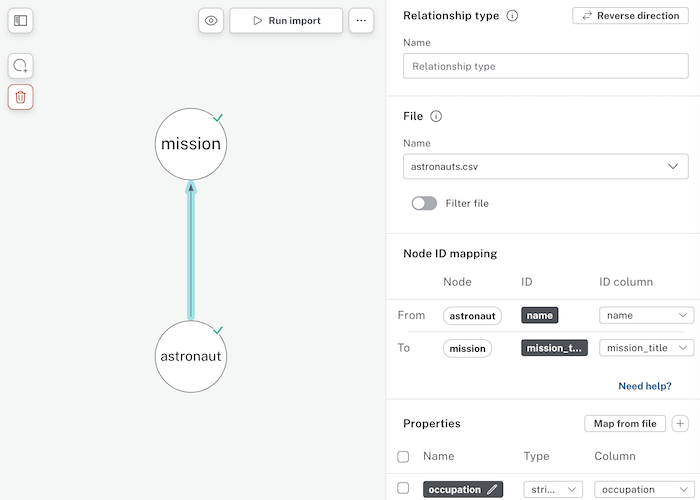
It’s important to get our Neo4j data model and visualization data models right. And we’ll likely want to use our Neo4j data for purposes other than just visualization. For that reason, we’ll assign properties where they naturally belong, without regard to how we’ll visualize them. This means we can use more natural Cypher queries. If we need to modify our visualization, we can do that in the client.
This is a very simple model with only two node types: missions and astronauts. And we have the many-to-many relationship that implies a graph model – astronauts can go on multiple missions, often with multiple crew members.
Assigning the properties is an interesting challenge. We can categorize sex and nationality as properties of the astronaut. And because the astronaut could have different functions in each mission, their role needs to be a property of the link. But what about the date, time and duration of the launch?
In most models, I’d put timing information on the link. But in this case, it’s a property of the mission. After all, the entire crew of a mission launches at the same time. And because our timing information is on a node rather than on a link, we’ll have to be a little clever with how we accommodate that when we bring that data into KronoGraph… more on that in the parsing section.
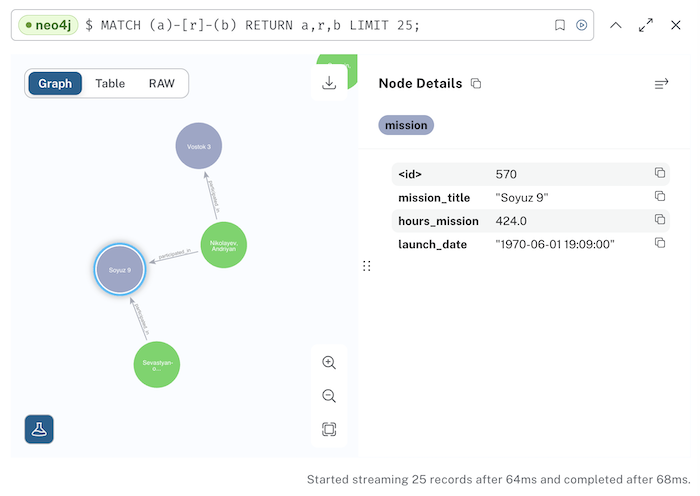
We can now switch over to the Neo4j browser and run a basic Cypher query, to ensure that the data was imported correctly and appears in the model we expect:
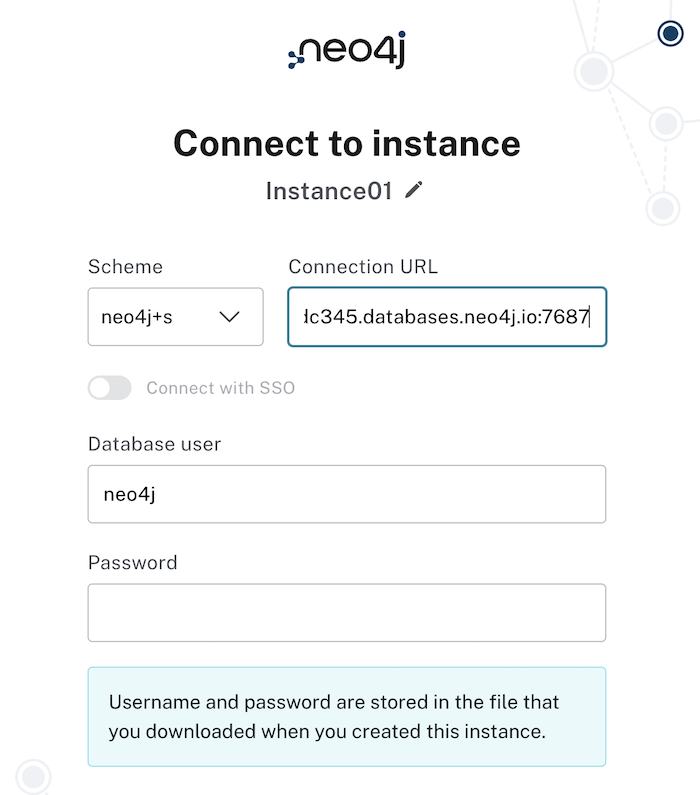
Now we need to make a note of our instance’s URL and credentials. The Bolt interface that Neo4j uses to connect to the database works in the same way we’ll connect from our application. Make a note of these, and we’ll use them in the next step:
2. Building a server-side module to connect to Neo4j
Next we’ll write a very short node.js module that takes a named query from the front-end, and translates it into a predefined bit of Cypher – which it submits to the database. When it gets results, it submits those back to the browser.
Although you could parse the results into the KronoGraph format here, I’m choosing to return the raw results to be parsed on the client side. That way, this service isn’t explicitly tied to KronoGraph, so it could be reused for other parts of the application – or even other applications.
In this router code, I’m using the built-in Neo4j Bolt driver and providing the credentials I saved in the previous step:
const Neo4j = require('Neo4j-driver');


/**
* Neo4j database configurations
*/
const configs = {
 boltPath: 'bolt+s://yourURL.Neo4j.io:7687',
 username: 'Neo4j',
 password: 'your PW',
};


// Set up the Neo4j Bolt driver
const driver = Neo4j.driver(
 configs.boltPath,
 Neo4j.auth.basic(configs.username, configs.password),
 { disableLosslessIntegers: true, maxTransactionRetryTime: 10000 },
);
This is also where I write the Cypher query. I’m intentionally keeping it as simple as possible, so this query will return all the data. Unlike node-link visualizations, where an iterative approach is the best practice, KronoGraph is designed to handle larger volumes of data. With our small dataset, we can pass all the data without the browser running out of memory.
const queryTemplates = {
 all: 'MATCH (a)-[k]-(n) RETURN a,k,n',
};
We could expand on our application later, and add additional queries here:
function setupEndpoint(
 app, // express app
) {
 app.get('/Neo4jdb/:queryType',
   async (req, res) => {
     const session = driver.session();
     res.on('finish', () => session.close());
     try {
       const response = await session.run(queryTemplates[req.params.queryType],
         { nameParam: req.query.name });
       let statement = response.summary.query.text.replace('$nameParam', `"${response.summary.query.parameters.nameParam}"`);
       statement = statement.replace('RETURN', 'nRETURN');
       console.info(`Neo4j statement: ${statement}`);
       res.send({ rawItems: response.records, statement });
     } catch (err) {
       console.error('Error connecting Neo4j', configs);
       console.error(err);
       res.send({ error: 'Error connecting Neo4j' });
     }
   });
}
This bit of code sets up a simple express endpoint that submits the Cypher to the database and returns the results. That’s it for our server-side code.
3. Building a Neo4j KronoGraph application
Next, we’ll use HTML, CSS and JavaScript to build a simple web application that contains KronoGraph. I’m keeping it as simple as possible to support a broad variety of architectures, but KronoGraph also has a React API that you can use if you’re building a React application.
Our HTML will be simple. To start, we’ll just put the KronoGraph component on the page and nothing else. We’ll add some other UI elements later.
<div id="kgdemo" style="width:100%; height: 100%;" class="timeline"></div>
Then in our Javascript, we’ll initialize the KronoGraph component and load the data:
async function loadKronoGraph() {


 await fontLoadPromise;


 timeline = createTimeline('kgdemo');
 // load KG with initial data
 kgData = await fetchData(initialQuery.type, initialQuery.name, true);
 timeline.set(kgData)
}
The fetchData function sends the query to the server to pass to Neo4j:
async function fetchData(queryType, querySearch) {
 const uri = getEndpoint(queryType, querySearch);


 let response;


 try {
   response = await fetch(uri, {
     method: 'GET',
     credentials: 'same-origin',
   });
 } catch (err) {
   console.log(err);
   throw Error(`Error while fetching ${queryType} "${querySearch}"`);
 }


 if (!response.ok) {
   throw Error(`Fetch failed with status ${response.status}`);
 }


 const content = await response.json();


 // if server returned some human readable error message
 if (content.error) {
   throw Error(content.error);
 }


 return {
   statement: content.statement,
   items: toKronoGraphFormat(content.rawItems, queryType, querySearch),
 };
}
It uses a queryType variable containing the type of query we’re running. We only have one at this point, called ‘all’, which requests all the data with no parameters. But here’s where we would add more if we had them:
const initialQuery = {
 type: 'all',
 name: 'unused',
};
Finally, getEndpoint just returns the endpoint for the query we’ve chosen:
function getEndpoint(queryType, querySearch) {
 return `/Neo4jdb/${queryType}?name=${querySearch}`;
}
We’d use the querySearch parameter if we wanted to return details of specific nodes or links. But in this scenario, we don’t need to – so I’ve left it empty.
So now, when the page loads, we’re running an initial query to populate KronoGraph. But that data isn’t in the right format yet – we’ll have to parse it first.
4. Parsing our Neo4j data for KronoGraph
Here’s where the first of our tradeoffs reveals itself. We intentionally kept both our graph data model and our server-side component simple, which means that we have a little more work to do with the returned data.
Our simple Cypher query will return an array of objects, where each has an edge and two nodes at its endpoints. This format would work well for a node-link visualization, but in KronoGraph (as in reality), events can have multiple participants. Each space mission had between one and up to 10 crew members.
As we step through each record, we can’t just create a new event every time. We need to see if that mission already exists, and add the additional crew member to that event. KronoGraph does this by having an entityIds[] array as a property of each event, which can have as many entities connected to them as necessary. Also, in our Neo4j data model the timestamp of the launch and the duration of the mission are properties of the mission object, but KronoGraph will require those on the event instead. So our parsing logic will look like this:
1. Step through each record and create an entity for the astronaut (since this is a dictionary, it’s OK if we repeat ourselves, it will just overwrite the old one with the same data).
2. Add the properties to the entity, such as sex, birthday, and nationality.
3. Create a new entity for the mission, using the same process as above, but don’t add properties for the duration or launch time.
4. See if an event already exists for that mission, and if so, add the current astronaut as an entity on that one instead of creating a new one. If it doesn’t exist, create a new event with a start and end time calculated from the timestamp of the launch, and the duration stored on the event node.
Here’s the code:
function toKronoGraphFormat(records) {
const entities = {};
const events = {};
let launchCount = 0;


records.forEach(item => {
  const [ astronaut, launch, mission ] = item['_fields'];


  // Add astronaut as an entity
  if (astronaut.labels[0] === 'astronaut') {
   const { name, nationality, sex, military_civilian: military } = astronaut.properties
    entities[name] = {
      type: 'Astronaut',
      data: {
        name,
        nationality,
        sex,
        military
      }
    }
  }

 // Add mission as an entity
  if (mission.labels[0] === 'mission') {
    const { mission_title: title, hours_mission: duration} = mission.properties
    entities[title] = {
      type: 'Mission',
      data: {
        title,
        duration
      }
    }
  }


  // An event connects the astronaut with the mission
  if (mission.labels[0] === 'mission' && astronaut.labels[0] === 'astronaut') {
   const { launch_date, mission_title, hours_mission } = mission.properties;
   const { name } = astronaut.properties;
   const missionStart = Date.parse(launch_date)
   let existingLaunch = null;

   Object.keys(events).forEach(eventId => {
     if (events[eventId].time == missionStart) {
       existingLaunch = events[eventId];
     }
   });
   if (existingLaunch) {
     existingLaunch.entityIds.push(name)
   } else {
     events[`launch-${launchCount}`] = {
       showArrows: false,
       entityIds: [name, mission_title],
       time: {
         start: missionStart,
         end: missionStart + (hours_mission * 60 * 60 * 1000) // convert hours to milliseconds
       },
       data: {
         role: launch.properties.occupation,
       }
    }
   }
  }
  launchCount++;
});
return { entities, events };
}
That’s all we need for a basic KronoGraph application! When the page loads, you should see the data showing in KronoGraph.
Instant insights from the KronoGraph heatmap
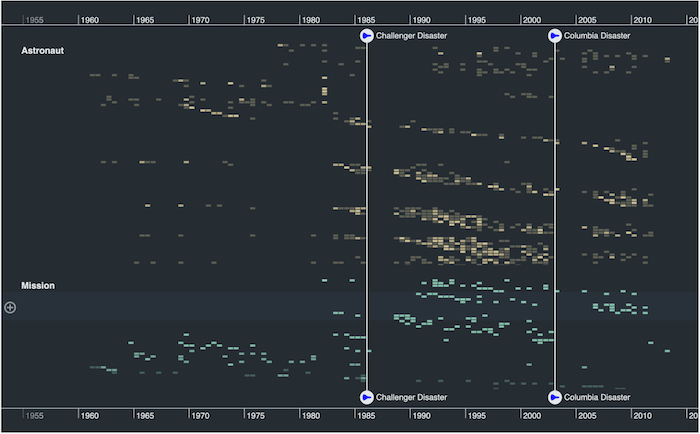
At this zoom level, KronoGraph doesn’t have enough space to show every individual astronaut and event, so it condenses the data into a heatmap overview of astronauts and missions.
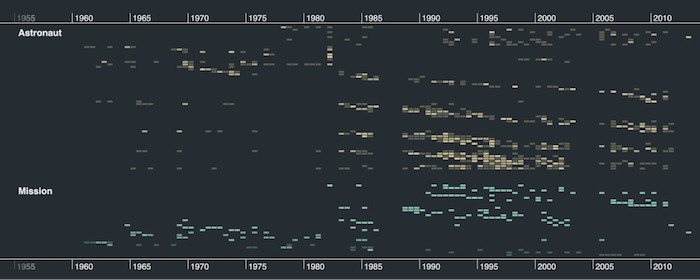
Even with no styling or customization, the application already offers insights into the story behind our dataset. The scattering of entities across our timeline becomes more dense as the frequency of spaceflights increases, driven by the Space Race between the United States and the Soviet Union during the 1960s, and then evolving into a more collaborative effort.
1986 saw the Challenger disaster, after which NASA suspended the Space Shuttle program for over two years and began developing a replacement for the aging Space Shuttle fleet. This is reflected by a clear gap in our visualization, with activity resuming in 1988 when the launch of Space Shuttle Discovery marked the resumption of space travel.
We see another pause in 2003 when the Space Shuttle Columbia disintegrated on reentry into Earth’s atmosphere, killing all seven crew members. This prompted another two-year suspension of the Space Shuttle program, resuming with the flight of Space Shuttle Discovery in 2005.
5. Styling and interaction for your timeline visualization
Let’s add styling to make the chart easier to understand, and interactivity to give the user more control over their investigation. First, we’ll use Entity Types to style and group entities differently, depending on whether they’re astronauts or missions. Here we’re modifying the end of the parsing function to select a color for each astronaut, and to group them by their nationality:
 let entityTypes = {};
 entityTypes.Astronaut = {
   color: '#e9d8a6',
   order: 1,
   groupBy: ['nationality']
 };
 entityTypes.Mission = {
   color: '#94d2bd',
   order: 2
 };
 return { entities, events, entityTypes };
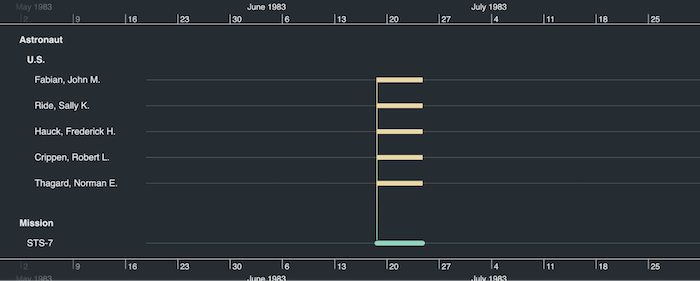
Now when we zoom in, we can see the nationality of the crewmembers of each mission. Here’s American astronaut Sally Ride’s famous 1983 flight:
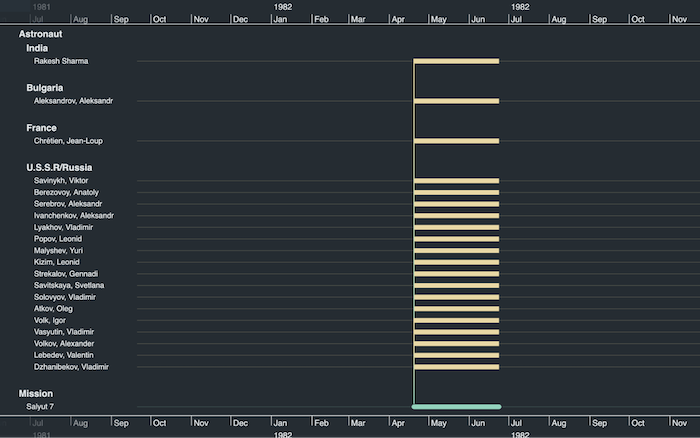
And here’s a long mission from 1982 that includes crew members from several different countries. It includes Rakesh Sharma, the first Indian citizen to travel in space – the trip made him a national hero.
If we need to ask more complicated questions of our data, we can take advantage of KronoGraph’s customization and styling options to code the entities and events in different ways.
Advanced customization
One of the properties in our data set is the sex of the astronaut. We could style female and male astronauts differently, but that might be tough to see at a distance. So we’ll take advantage of KronoGraph’s “ping” feature to highlight missions that had at least one female crew member.
The Ping function
To do this, we need a little bit of code to pick out the events from a property of the entity, but it’s not difficult. I’ve added a button to the page, and when clicked, I assemble an array and pass that to the ping function:
Now we can interact with the chart to highlight the nodes on the map that represent female astronauts. Growing up in the USA in the 1980s, I’d always thought that Sally Ride was the first woman in space. But adding ping animation to our heatmap quickly proves me wrong: the Soviets sent Valentina Tereshkova and Valentina Ponomareva to space decades earlier.
Ping creates a very brief flash designed to quickly draw the user’s eye to specific events. What if we want something more permanent? We can use the reveal function to highlight specific events, even when the heatmap view is active. Let’s use another property on the astronaut that tells us their nationality. Here I’m revealing the missions that contained at least one crew member from France. A very similar function gives us that list:
function getAllEventsByCountry(countryName) {
 const { events, entities } = kgData;
 let eventList = [];
 Object.keys(events).forEach(eventId => {
   if (events[eventId].entityIds !== undefined) {
     events[eventId].entityIds.forEach(connectedEntityId => {
       if (entities[connectedEntityId].data.nationality === countryName) {
         eventList.push(item);
       }
     });
   }
 });
 return eventList;
}
“Joining the dots” between astronaut and mission reveals to us, at a glance, which missions had people from France aboard. We can see the revealed events in the context of the heatmap, and we can zoom in further to see the events in more detail.
Markers
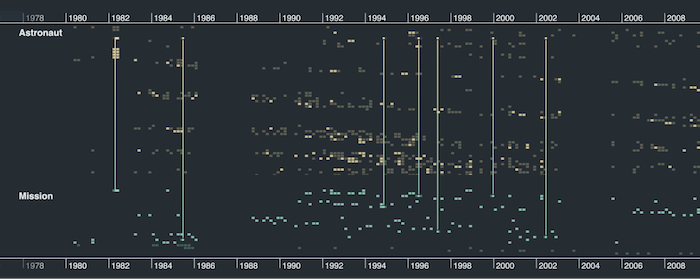
We can use markers to highlight durations of interest, or points in time. For instance, we can call out the two major shuttle disasters in our dataset by using the Markers API:
 markers.push({label: 'Challenger Disaster', time: Date.parse('1986-01-28 16:39:13'), fontIcon: {fontFamily: 'Font Awesome 5 Free Solid', color: 'rgb(0,0,255)', text: ''}});
 markers.push({label: 'Columbia Disaster', time: Date.parse('2003-02-01 13:59:00'), fontIcon: {fontFamily: 'Font Awesome 5 Free Solid', color: 'rgb(0,0,255)', text: ''}});
This draws the user’s eye to the gaps in our visualization, and we can use enhanced styling options to give a quick understanding of what’s being highlighted. I’ve chosen space shuttle icons, and labeled the markers with the events they represent:
Launch your own timeline visualization exploration
Now that you’ve seen how easy it is to create a powerful and insightful data analysis tool with KronoGraph, why not give it a try on your own data? I used Neo4j, but other datastores are available.
Request a trial today – the sky’s no longer the limit!
Share:
