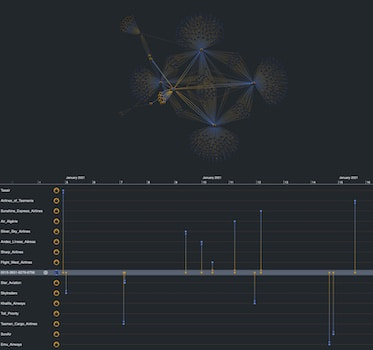
Astronomical insights with Neo4j and KronoGraph
Corey Lanum Chief Product Evangelist
14th November, 2023 | 15 min read
In this tutorial, you’ll find out how to use Neo4j and KronoGraph to create an interactive timeline...
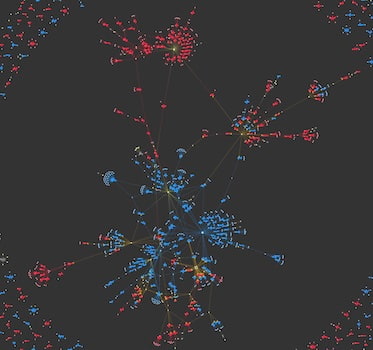
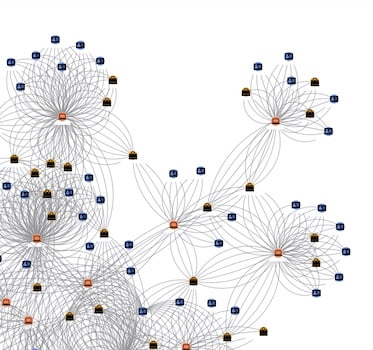
Surprising visual insights from US election campaign data
Corey Lanum Chief Product Evangelist
31st October, 2023 | 6 min read
I use graph visualization to reveal insights in US election campaign data: which orgs donate to both Republican...
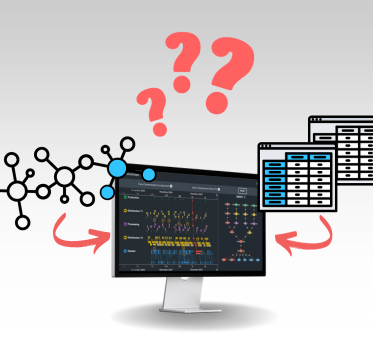
Visualizing graph data without a graph database
Corey Lanum Chief Product Evangelist
25th October, 2023 | 12 min read
What datastore is best for visualizing graph data? Graph databases are often a great fit, but you have more...
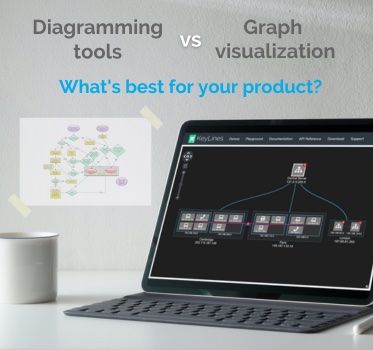
Stretched your diagramming tools to the limit? Here’s the solution
Corey Lanum Chief Product Evangelist
31st May, 2023 | 6 min read
When diagramming tools aren’t working hard enough for you, it’s time to upgrade to the insightful...
Want a 10% increase in ROI? Add a data visualization component
Corey Lanum Chief Product Evangelist
25th April, 2023 | 10 min read
How do you measure the value of adding data visualization to your web app? If you choose to build a visualization...
How to build a Neo4j visualizer with KeyLines
Corey Lanum Chief Product Evangelist
4th April, 2023 | 14 min read
In this tutorial for JavaScript developers, I’ll demonstrate how to build a Neo4j visualizer with our graph...
Identity fraud detection with Amazon Neptune
Corey Lanum Chief Product Evangelist
3rd January, 2023 | 15 min read
Follow this tutorial to build an interactive web application – integrated with Amazon Neptune – to...

Graph visualization techniques that are child’s play
Corey Lanum Chief Product Evangelist
25th October, 2022 | 11 min read
Graph visualization is a serious business. But there’s no denying that graphs can also be fun. In this blog...
Easy visual analytics for data scientists with KeyLines
Corey Lanum Chief Product Evangelist
2nd August, 2022 | 13 min read
In this technical blog post, I show you how to get KeyLines, our JavaScript toolkit for graph visualization,...
