Summary: This article explains when teams should move from static diagramming tools to interactive graph visualization. Diagramming tools are great for quick, shareable snapshots, but they struggle when networks or systems become large, dynamic, or frequently changing. Graph visualization connects directly to live data, supports filtering and exploration, and helps users investigate and analyze complex relationships. If your diagrams are becoming hard to maintain or no longer reveal insight, it may be time to update to visualization technology.
If you need shareable visualizations of your connected data, there are countless options available. Among the most popular are diagramming tools that produce flowcharts, floor plans and other static diagrams. But increasingly, successful businesses recognize the need to take their projects to the next level with graph visualization.
In this post, I’ll look at where the two domains differ and answer the key question: how do you know when it’s time to upgrade from a diagramming tool to insightful visualization technology?
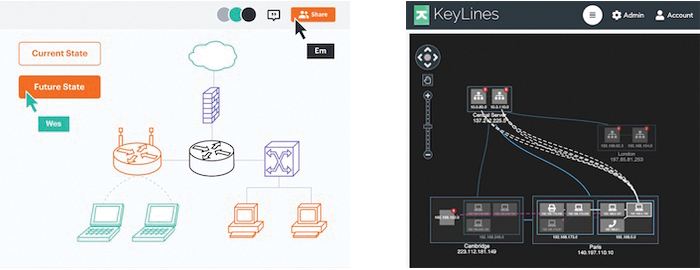
An IT network represented in a diagram and a graph visualization
On the surface, diagramming and graph visualization seem pretty similar: the end result of both is a shareable representation of entities and their connections. But the two domains are very different. Interactive graph visualization elevates your perspective, simplifies complex data and uncovers hidden insights that diagrams can’t reveal.
If you’ve stretched your diagramming tools to the limit, you’re ready to consider graph visualization.
Stretching the limits of diagramming tools
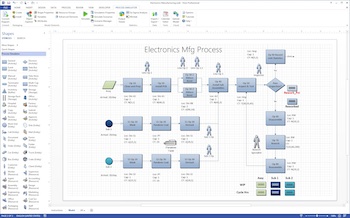
Flow charts and mind maps have been around for at least 100 years, and demand for diagramming tools exploded in the 90s. As computer networks grew in size and complexity, businesses turned to diagramming tools like Microsoft Visio.
LucidChart, Miro, SmartDraw and similar applications make it easy to draw complex diagrams. They create everything from simple flowcharts to brainstorming mind maps, but a common use case is charting the topology of computer networks. IT systems architect’s rely on them to map existing or plan new infrastructure models using a common language to share an exact vision.
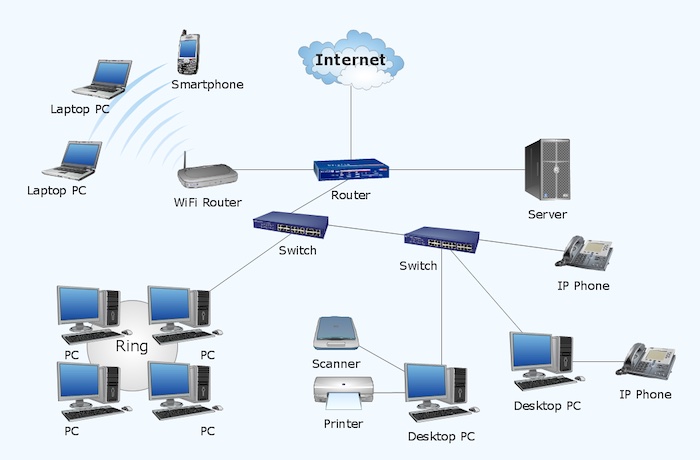
But what happens when the infrastructure changes and networks become more complex? The architect’s original diagram is no longer fit for purpose. There’s no direct connection between the diagram and the data, so somebody has to spend time manually updating the diagram (or several diagrams). How can you keep track of a modern network with tens of thousands of assets? It’s an impossible task.
That’s why more and more IT networking teams have moved to graph visualization to help them automate the process. Diagramming tools can only produce a static image whereas a graph visualization is interactive, dynamic, and connected to one or more data sources.
What is graph visualization?
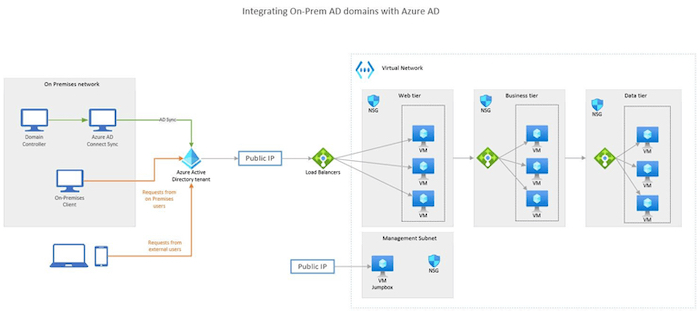
In graph visualization, the diagram is just the starting point. You work with an interactive visualization to generate insights from vast amounts of densely-connected data using techniques like dynamic layouts, data-driven styling, complex filtering, and analytical algorithms. The visualization is usually linked to a data source, so the diagram is generated and updated automatically – not drawn by the user.
A static diagram needs to show all the information that could possibly be relevant to the viewer. This brings problems of scale and complexity, because it’s harder to render and understand large diagrams. Graph visualization tools handle large volumes of data, and present “detail on demand” as users interact with the chart and filter information to suit their needs.
Here’s how a graph visualization simplifies an IT network investigation. It untangles a busy part of the network and displays it in a way that makes the assets and connections easy to understand. We can select an asset of interest and narrow down a specific section of our network. Toggling an “alerts list” view color codes the elements so that we can identify any alerts. Finally, we can zoom right in to get detailed information on a specific alert, from the custom labels and glyphs:
The “expand and explore” function lets users drill into the detail that interests them without losing context:
When a group of assets appear in a static diagram, you’ll usually see them placed together in a bounding rectangle. Grouping items is helpful, but it doesn’t simplify the chart. In fact, it can make it more complex:
A Visio diagram of grouped network devices
Our graph visualization tools use combos to declutter the chart and give clearer insight into an IT network. Users can group similar assets, such as network devices that share a common subnet, into flexible combo nodes. They open the combos to explore what’s inside, and close them when they want to reduce clutter in the chart. Custom styling and glyphs make it easy to identify directional links, asset types and the number of assets in each group.
This chart is linked to a dynamic database that’s updating constantly, so the chart adapts automatically. Alerts stand out, so it’s easy to identify and investigate warnings:
So which is the best tool for your project?
Bring graph visualization to your users if they need to:
- integrate multiple linked datasets
- manage complex, connected and constantly changing data
- investigate and analyze their data
Stick with diagramming tools if your users:
- need a quick and shareable snapshot of their data
- are familiar with their data already
- don’t need to carry out in-depth analysis to reveal insights
If you’ve stretched your diagramming tools to their limits, it’s time to try graph visualization.
Share:
