FREE: Misinformation, disinformation & online safety
Find out how data visualization and AI technology helps to keep us safe from false online content.
This blog post investigates misinformation and disinformation – what it is, why it’s harmful, and what’s being done to protect us from it. It looks at the role data visualization plays to detect, investigate and prevent misinformation and disinformation, and keep digital spaces safe.
Lies and falsehoods are nothing new. What’s changed in recent years is how information intended to deceive has been weaponized by certain governments, ideological protest groups, alternative news outlets and other bad actors. They exploit new technologies to create AI-generated false information, and harness the power of global social media platforms to spread their messages far and wide.
Find out how data visualization and AI technology helps to keep us safe from false online content.
Research suggests that every day, most of us tell one or two lies, and we’re lied to between ten and 200 times. Is that a big deal? It depends on the intent behind those lies.
Intention draws a clear distinction between sharing false or inaccurate information, known as “misinformation”, and sharing deliberately malicious information, known as “disinformation”. There’s a vast difference between telling a friend about a news story you believed was true that turned out to be false, and a bad actor creating and sharing an entirely-fabricated news story that encourages mistrust of organizations, individuals or political systems.
This type of content is typically designed to trigger an emotional response. Research by the US National Library of Medicine shows that when we rely on emotion to understand mis/disinformation, we’re less rational and more likely to believe it. Additional research shows that we’re also more likely to share it with others. It’s an effective strategy for bad actors, as unsuspecting media consumers distribute their malicious content for them.
The reasons for creating misinformation and disinformation can vary greatly, but all bad actors have one thing in common: they seek to infiltrate and influence public discourse for their own ends.
They may seek to interfere in democratic processes, seek financial gain for themselves, promote their own ideologies, or have a different news agenda to push. At greatest risk are political institutions, public agencies involved in elections, public health, defense and intelligence, societal communities – particularly vulnerable groups and minorities – and media outlets.
We’re also seeing a significant rise in the number of private corporations at risk. Misinformation and disinformation attacks spread harmful narratives about their people, brand, culture and products. These are often timed around key events for maximum threats to security or financial performance, such as just before an annual general meeting (AGM) or initial public offering (IPO).
Mis/disinformation isn’t a new phenomenon. What makes it more effective as a weapon in recent times is the way it’s perpetuated across digital and social media platforms, combined with the availability of easy-to-use AI tools to manufacture false content.
Platforms like X, Facebook and TikTok give bad actors easy access to the perfect tools for spreading misinformation and disinformation. Each platform uses social media algorithms to drive personalized news feeds and content recommendations, which can present falsehoods as facts. These are then shared – often unwittingly – amongst closely-connected networks of family and friends, and so the falsehoods are perpetuated.
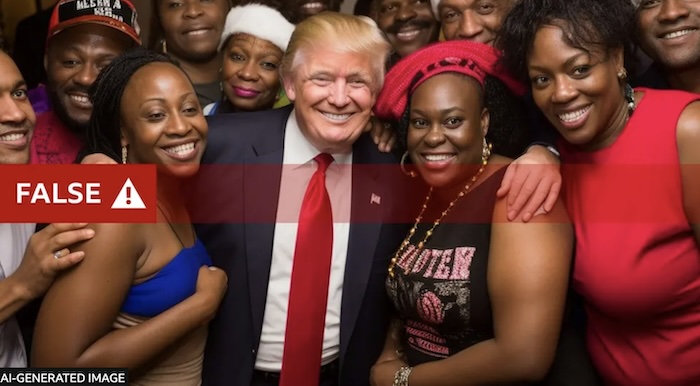
Many sophisticated apps for creating AI-generated content are widely available, easy to use and free. Bad actors with no coding experience can create high-quality content in seconds. Deep fake images or video content, speech synthesis and other synthetic media can make trusted figures appear to endorse everything from products to problematic world leaders and controversial ideologies to fake events.
There’s also been a significant rise in the number of automated, semi-automated or AI-generated bots. They currently account for around 50% of all online traffic. According the social threat intelligence company, Cyabra, Between 4-8% of accounts participating in conversations are bots. For US election conversations, that goes up to 68-95% of accounts.
Multiple bots are used in coordinated campaigns to create a ‘buzz’ around a particular product, person or event. But bad bots are programmed to perform malicious activities, imitate humans and evade detection.
Some regulators are putting strategies in place to force social media platforms to create a safer, fairer digital space, with eye-wateringly high financial penalties if they don’t comply:
Technological advancements move faster than government legislation, so there’s a reliance on social media platforms and AI companies to act as the first line of defense against misinformation and disinformation. There’s a responsibility for tech organizations to think about how their evolving technology could be misused, and mitigate as many of those misuses as possible.
As demand for authenticity and transparency grows, there’s a drive for investment in tools to make finding mis/disinformation easier.
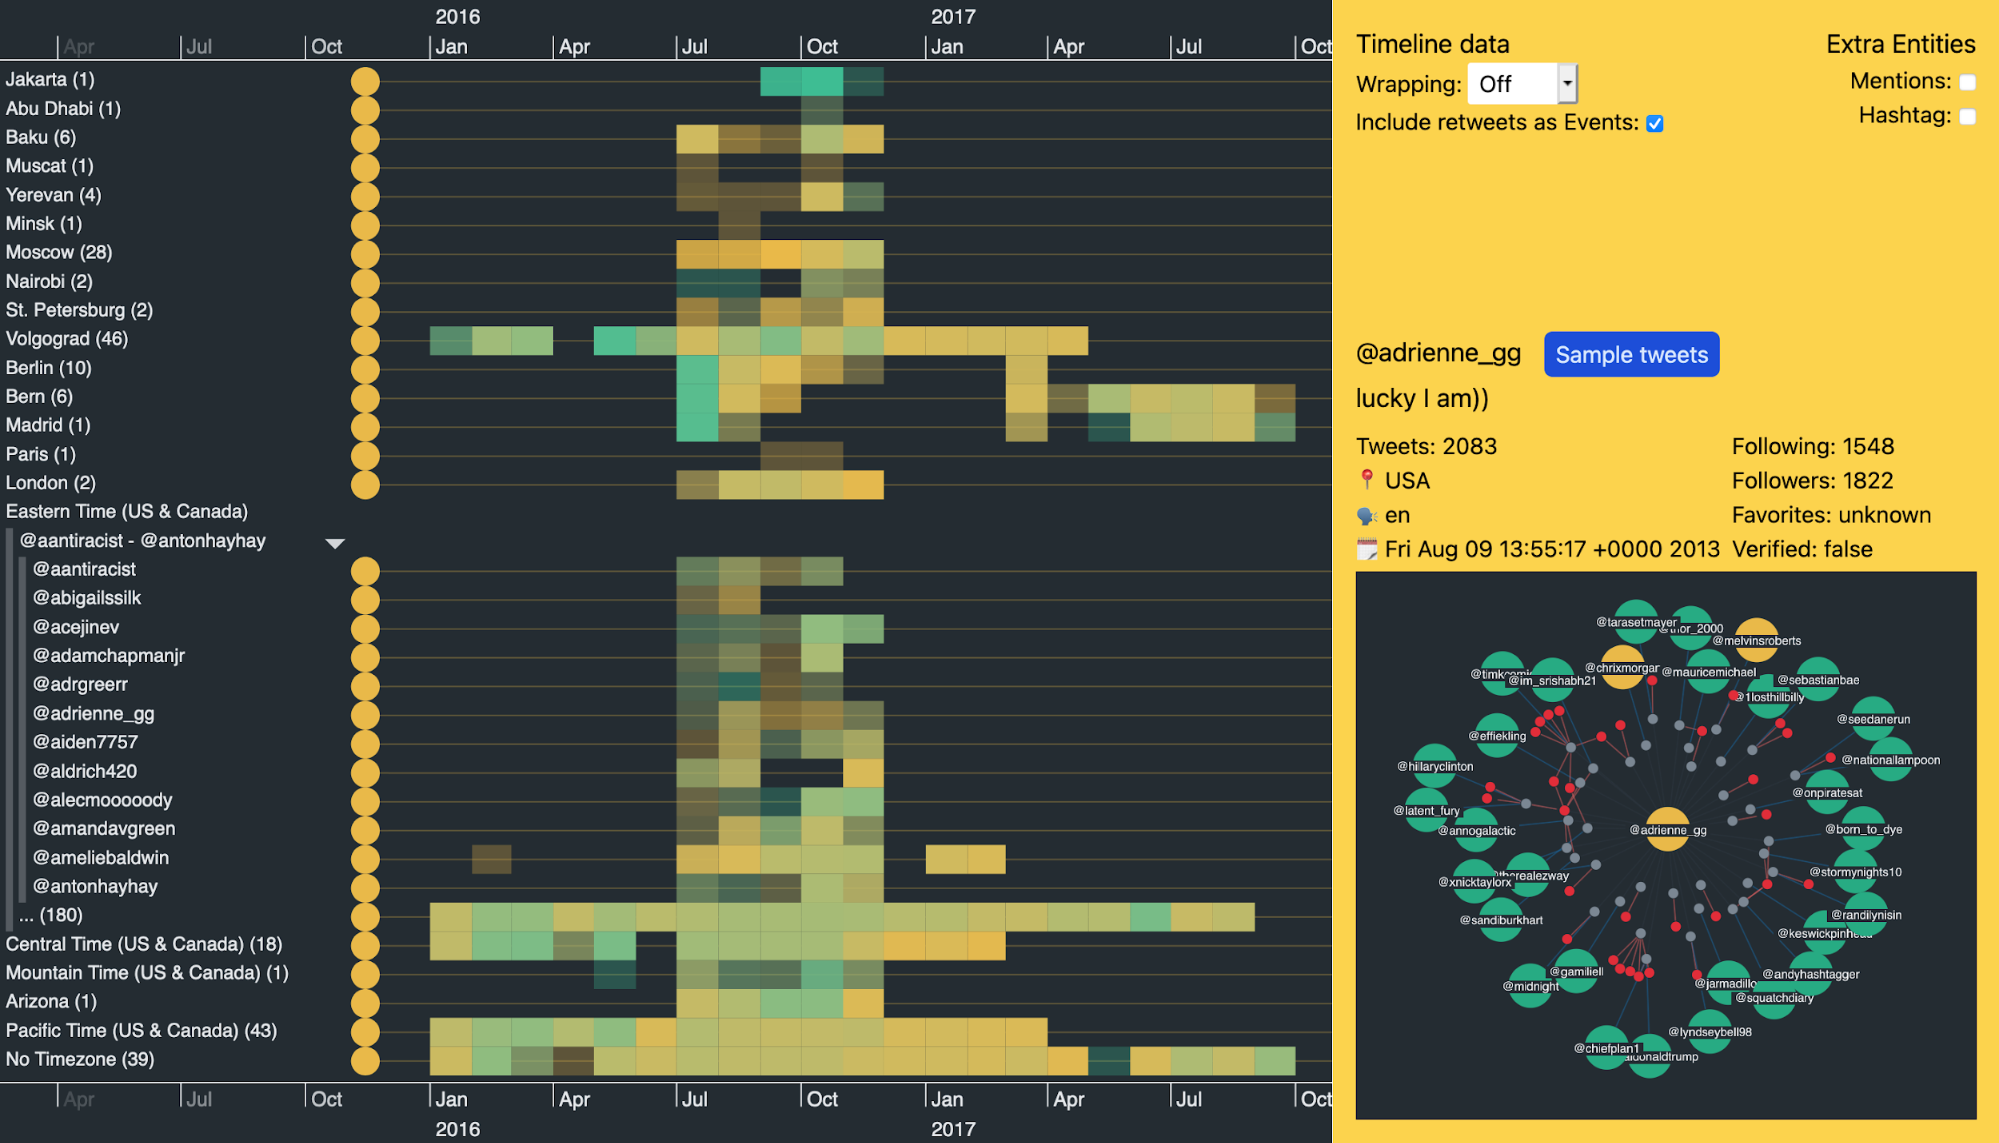
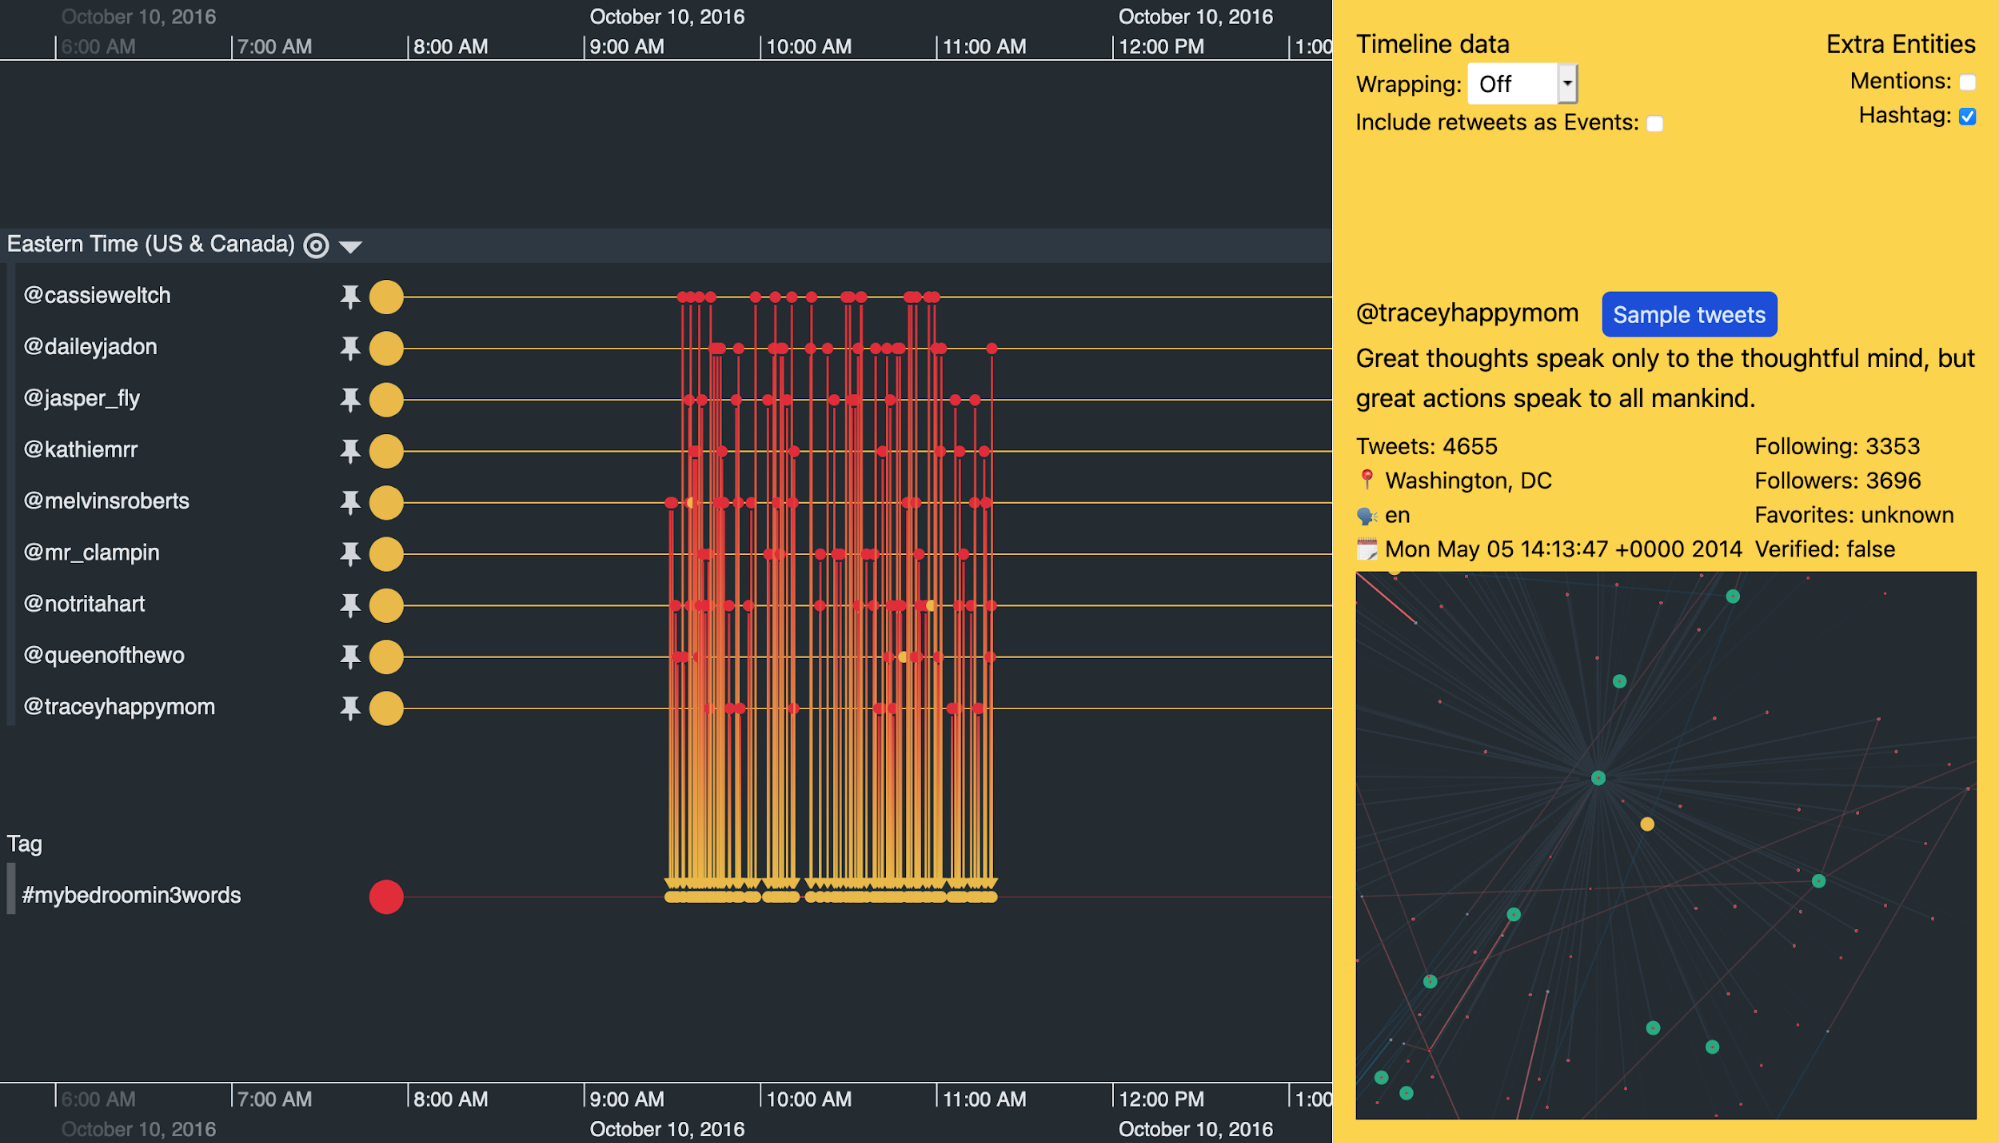
You need to understand how it spreads between accounts and platforms. That starts with finding the source in a network, then uncovering how and when they spread misinformation and disinformation more widely. The easiest way to do this is through data visualization.
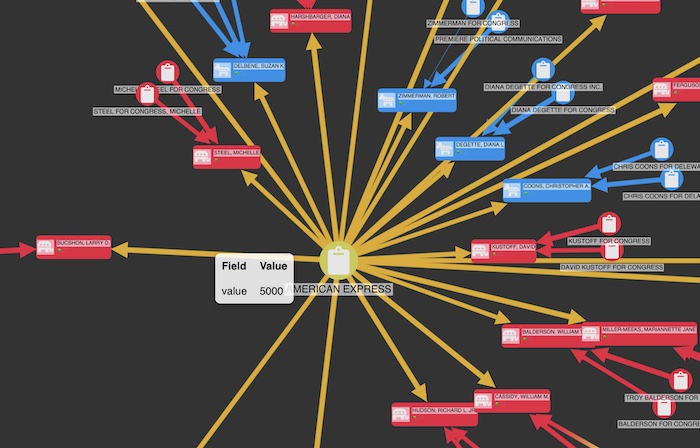
Graph and timeline visualization lets analysts and investigators interact with their connected data, identify who’s linked to whom, reveal trends and patterns of behavior, and understand the context of the misinformation and disinformation landscape. They uncover interesting relationships hidden in complex networks of tightly-connected social media accounts, and help them make quick, reliable decisions.
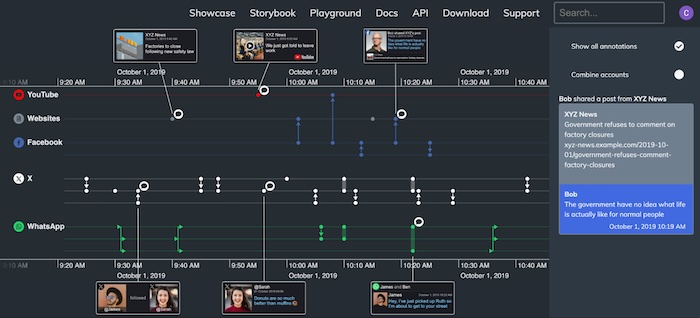
The human experts responsible for reviewing AI-generated alerts also need help to understand the context of each flagged case. Data visualization is the best way to do this, making sense of complex AI outputs more easily.
For a deeper dive into the topics we’ve discussed here, download the misinformation, disinformation & online security white paper. You’ll find more details, including a detailed guide to the misinformation and disinformation analyst’s investigative workflow, and how data visualization supports every vital stage.
Or if you’re ready to see how graph and timeline visualization will improve your online safety project, request a free trial.

Visualize your data! Request full access to our SDKs, demos and live-coding playgrounds.
Registered in England and Wales with Company Number 07625370 | VAT Number 113 1740 61
6-8 Hills Road, Cambridge, CB2 1JP. All material © Cambridge Intelligence .
Privacy Policy | Security Framework


