In this tutorial, we’ll build an interactive graph visualization web application integrated with Amazon Neptune to visualize and analyze identity fraud.
Using the KeyLines SDK for graph visualization and the KronoGraph SDK for time-based analytics, our application gives end users two powerful ways to visualize the same data for their identity fraud detection processes.
Why visualize identity fraud?
According to Onfido, identity fraud has risen by 44% since 2019. As the number of online transactions increases, so do incidences of identity theft through hacking, phishing and large-scale data breaches. And once fraudsters access a person’s identification details, they use them to obtain goods or services through deception.
Fraud analysts and investigators face an expensive and complex problem: how do you keep up with the increasingly sophisticated strategies adopted by identity fraudsters and at scale?
To solve this, they need to see connections – between people, accounts, transactions, and dates – and understand complex sequences of events. Visualizations create simple, intuitive views that are quickly understood, highlighting unusual patterns of behavior or known techniques used by fraudsters.
Many organizations rely on our JavaScript and React toolkit technology to visualize their Neptune graph data. They’re popular with developers who need a flexible API to build high-performance, customized data visualization components for their web applications.
Skip to the identity fraud detection visualizations or keep reading to start the tutorial.
Building an identity fraud detection application
We’ll follow these steps to build the application:
- Add Amazon’s sample fraud application data to our Neptune database using Amazon Sagemaker Studio
- Set up the Amazon Lambda service to submit server-side Gremlin queries
- Use Amazon API Gateway as a proxy so the web-based front end communicates queries back to the Lambda service
- Use HTML and JavaScript to add KeyLines and KronoGraph to a web page and parse the results to show the graph
- Use our interactive web application to spot suspicious activities that match the profile of identity fraudsters
As well as access to the AWS services mentioned above, you’ll need access to our KeyLines and KronoGraph SDKs.
You’ll also need to connect the open-source Jupyter Notebook to Neptune
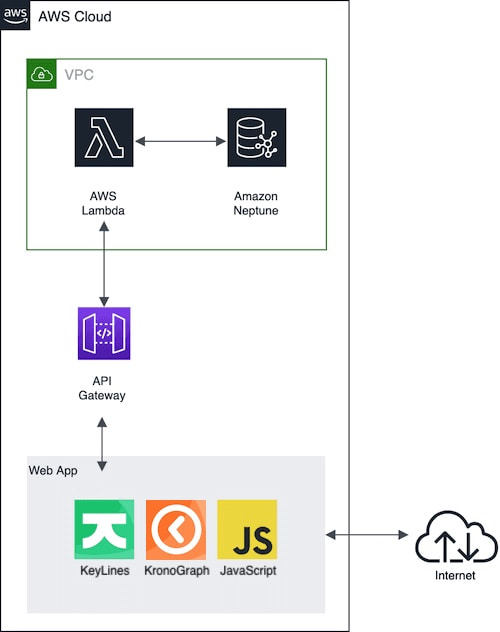
Here’s the application architecture:
Our identity fraud detection dataset
Thankfully, Neptune graph notebooks make it easy to add data to AWS Neptune. They’re provided automatically with new Neptune instances and don’t require any setup, making them a great time-saving option for developing our application. They offer a simple way to create new queries and view results, then port the most useful queries over to a hosted web application.
To get started, we use Amazon SageMaker Studio to create and host a graph notebook and take care of our database connection. It comes preconfigured with the magic commands for seeding the database and issuing queries, and provides an extension of the JupyterLab interface. Here’s the process for creating a graph notebook. You could even embed KeyLines graph visualizations in the individual cells of the notebook: see Visualize graph data in AWS Neptune Graph Notebooks using KeyLines in our Amazon Neptune blog category.
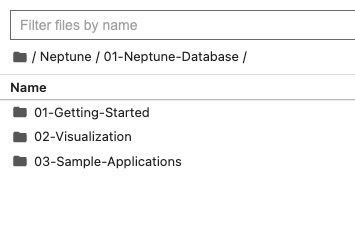
In JupyterLab, we see that four folders have been created automatically. We’ll look at /Neptune/01-Neptune-Database/03-Sample-Applications.
The sample applications include a Fraud Graph containing:
- credit card accounts
- properties of those accounts (phone numbers, IP addresses, physical addresses, date of birth of cardholder)
- times and dates of transactions with merchants
The only required step here is to use the %seed line-magic in the first cell, which populates our Neptune database with the sample data:
%seed --model Property_Graph --dataset fraud_graph --run
Now we have some interesting data in Neptune to use in our identity fraud detection application. Let’s configure the Lambda service.
Build a Lambda function to query Neptune
AWS Lambda gives developers a way to build functions that can take inputs and process the data without requiring a separate server. We’ll use a Lambda function to take a query from our web application, submit it to Neptune, and then pass the results back to the requester.
-
- Create a new Lambda function from the AWS Console.
- Make sure it shares the same VPC as your Neptune instance and uses a new security group with correct permissions.
- Direct the Lambda function to the endpoint URL:
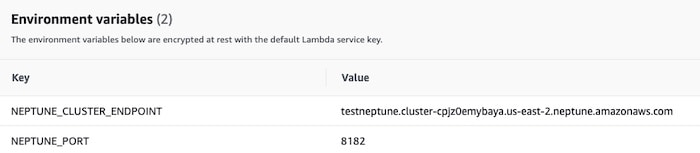
- We’ll use JavaScript and Node.js to run the function, and the Gremlin JavaScript driver to enable Gremlin traversals. To upload the gremlin driver and its dependencies:
- Run npm install gremlin on your local computer.
- Use the Upload From button on the Lambda code page. The uploaded zip file contains the node_modules folder
Now we can write some simple code. This code sends a Gremlin query asking for all the nodes connected to an account ID, and returns those results as a JSON object.
const gremlin = require('gremlin');
const __ = gremlin.process.statics;
const withOptions = gremlin.process.withOptions;
exports.handler = function(event, context, callback) {
  const DriverRemoteConnection = gremlin.driver.DriverRemoteConnection;
  const Graph = gremlin.structure.Graph;
  const endpoint = `wss://${process.env.NEPTUNE_CLUSTER_ENDPOINT}:${process.env.NEPTUNE_PORT}/gremlin`;
  const dc = new DriverRemoteConnection(endpoint, { mimeType: 'application/vnd.gremlin-v2.0+json' });
  const graph = new Graph();
  const g = graph.traversal().withRemote(dc);
  const headers = {
    'Access-Control-Allow-Methods': 'OPTIONS, POST, GET',
    'Access-Control-Max-Age': 2592000, // 30 days
    'Access-Control-Allow-Headers': '*',
    'Content-Type': 'application/json'
  };
  const coreResponse = {
    statusCode: 200,
    headers: headers
  };

  if (event) {

    g.V(event.id)
      .inE()
      .outV().valueMap(true)
      .path()
      .toList()
      .then(data => {

        const body = JSON.stringify(data);
        const response = { ...coreResponse, body };
        callback(null, response);
        context.done();
        dc.close();
      });
  }
};
It’s important to test the Lambda function at this stage to make sure it’s set up correctly. The test pane helps with this. If you submit a simple JSON object, for example:
{
  "id": "account-8698"
}
You’ll see the results in the returned JSON (truncated here):
"body": "[{\"id\":\"dc8c24094a20457f9bee482b4a4e7757\",\"label\":\"Transaction\"},
If you see results in the body, then your Lambda function is working. We can move on to wrapping it into a publicly accessible API.
Use the AWS API Gateway to create a REST endpoint
The Lambda function will now query the Neptune database, but we need a publicly accessible endpoint for the actual application to submit those queries. We can create this using the Amazon API Gateway.
Sign in to the API Gateway console and under REST API click Build. Enter the following properties:
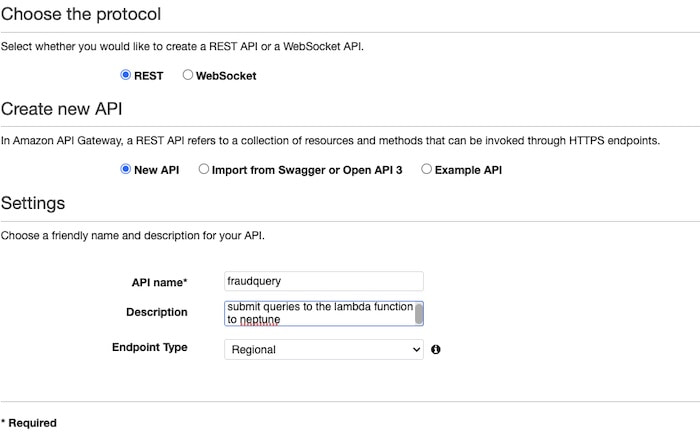
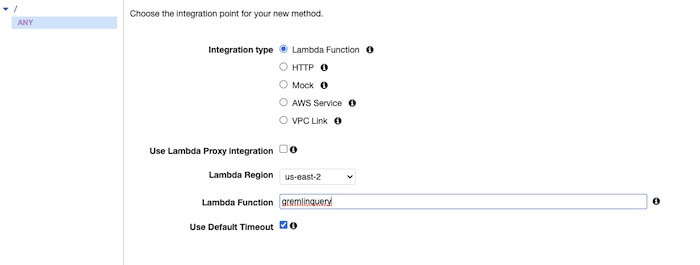
Then you can bind the API to the Lambda function you created in the previous step:
We’ll need to create a response for HTTP POST and bind that to the Lambda function (ANY won’t work because of cross-origin issues):
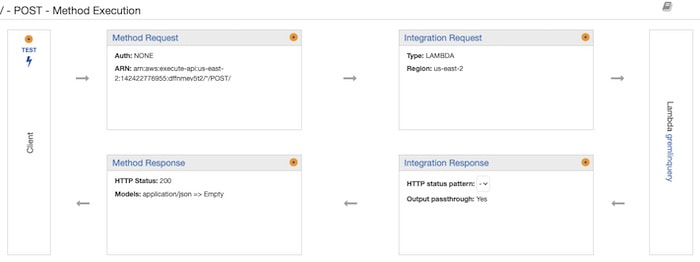
To test the API configuration, submit an HTTP POST with the same JSON as we used to test the Lambda function. The API Gateway will now give you a URL for the endpoint that you can use to submit your query – in this case, the ID of an account where you want the associated details.
And, with that, we have a complete AWS Neptune instance running, ready to provide data for our identity fraud detection visualizations.
Build a web page with KeyLines and KronoGraph
Now we can build our identity fraud detection web application. It’ll host the KeyLines and KronoGraph libraries and communicate with the API back-end we just built.
You’ll find detailed getting started tutorials on both SDK sites when you sign up for a free trial.
To give you an idea of how to add KeyLines and KronoGraph to the page, it just needs some simple HTML:
<!DOCTYPE html>
<script type="module" src="index.js"></script>
<link rel="stylesheet" href="index.css" />
<link rel="stylesheet" href="fontawesome/css/fontawesome.min.css" />
<link rel="stylesheet" href="fontawesome/css/solid.min.css" />
<html>
<body>
   <div style="display: flex; flex-direction: column; height: 100pc">
     <div id="chart" style="flex: 1"></div>
     <div id="timeline" style="flex: 1"></div>
   </div>
</body>
</html>
In our JavaScript, when the page loads, we’re going to query the AWS API Gateway – passing in an id to query and getting the result in JSON:
const URL_OF_AWS_API = 'your API gateway URL here';
export const queryRest = async (queryString) => {

   const body = `{
       "id": "${queryString}"
     }`;

       const init = {
         method: 'POST',
         body
       };

       const response = await fetch(URL_OF_AWS_API, init);
       console.log(`response status is ${response.status}`);
       const mediaType = response.headers.get('content-type');
       let data;
       if (mediaType.includes('json')) {
         data = await response.json();
       } else {
         data = await response.text();
       }
       parseData(data);


};
We also need to define a visual model of the details in our database. Getting this right is important. Identity fraud detection processes involve a lot of data, so we need to be selective but also give users clear visual cues to help them interpret the nodes and links.
Every chart item is customizable, so we’ll use icons for nodes and assign colors to make them stand out:
const visMap = {
   Account: {id: 'account_number', color: '#6495ED', fontIcon: '\uf2bb' },
   IpAddress: {id: 'value', color: '#FF7F50', fontIcon: '\uf109'},
   EmailAddress: {id: 'value', color: '#B22222', fontIcon: '\uf1fa'},
   PhoneNumber: {id: 'value', color: '#BDB76B', fontIcon: '\uf095'},
   Address: {id: 'value', color: '#8B008B', fontIcon: '\uf015'},
   DateOfBirth: {id: 'value', color:'#008B8B', fontIcon: '\uf1fd'},
   Merchant: {id:'name', color: '#e09d16', fontIcon: '\uf290'}
  }
You might notice that transaction nodes are missing here. That’s because, in my database, transactions are stored as nodes. But in my visual model, I want to represent them as links. I’ll explain why in the next section.
Next, we need to parse the data into the JSON format that KeyLines and KronoGraph recognize:
const parseData = (data) => {

   jsonData = JSON.parse(data.body);
   //nodesInfo and linksInfo are defined earlier as empty arrays
   //data is an array
       jsonData.forEach(element => {
	    //this is where in the array our nodes and links can be found
	    let startNode = element.objects[0];
	    let link = element.objects[1];
	    let endNode = element.objects[3];
           if (endNode.label != 'Transaction') { //ignore transaction paths for now, we'll treat them separately
           //add the origin node if it's not found
           if (!nodesInfo.some(e => e.id === startNode.id)) {
             nodesInfo.push({id: startNode.id, name: startNode.id, color: visMap[startNode.label].color, fontIcon: visMap[startNode.label].fontIcon });
           }
           //add the link if it's not there
	    //a link will be defined by its ID and looking at the two endpoints
             if (!linksInfo.some(e => e.id === link.id)) {
                 linksInfo.push({id: link.id, id1: startNode.id, id2: endNode.id});
             }
           //add the destination node if it's not found
           if (!nodesInfo.some(e => e.id === endNode.id)) {
               //ignore transactions for now
                 nodesInfo.push({id: endNode.id, name: endNode[visMap[endNode.label].id][0], color: visMap[endNode.label].color, fontIcon: visMap[endNode.label].fontIcon });
             }
           }
       });

  return [...nodesInfo, ...linksInfo];

}
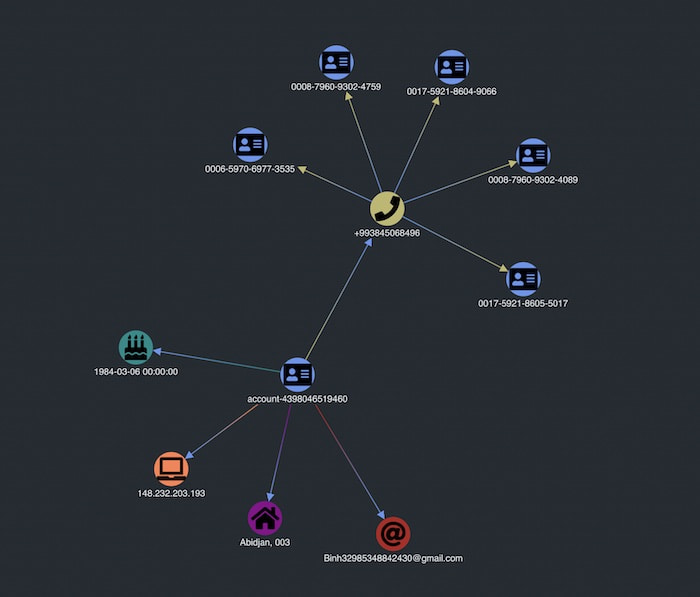
Now let’s query an individual account. When the page loads, KeyLines displays the properties of that account:
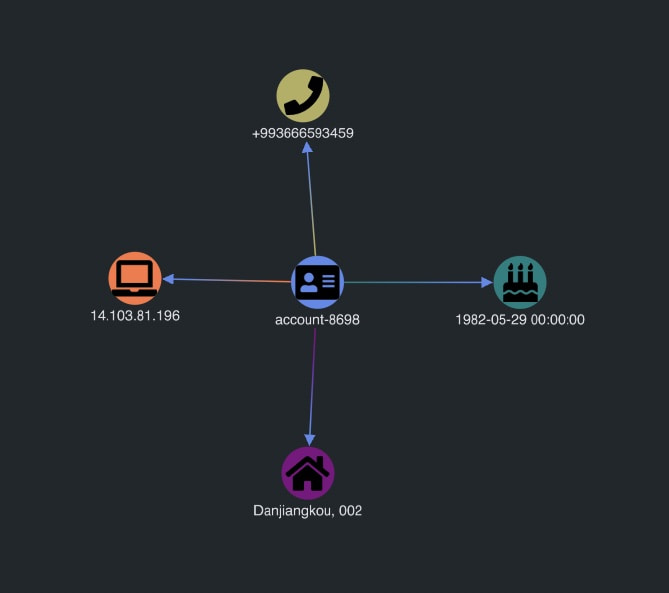
Our visualization is up and running! Now we can start investigating some more complex data.
Querying Neptune from our identity fraud detection application
KeyLines charts are fully interactive. The natural next step after querying an individual account is to find out who might share the same properties. It may be typical for two account holders to share a common physical address if they are family members, for example, but several dozen sharing the same address is suspicious.
We want to run a new query focusing on the clicked item and add new data to the chart. To do this, we’ll tell KeyLines to expand when a user double-clicks on a node:
chart.on('double-click', () => expandData(chart.selection()));
Then we re-use the expandData function to call back to the database:
 async function expandData(selection) {
   if (!isEmpty(selection)) {
     //only if the user double-clicked on a node
     if (chart.getItem(selection[0]).type === 'node') {
       let newItems = await queryRest(selection[0]);
       await chart.expand(newItems);
       chart.layout('organic');
     }
   }
 }
This expand behavior is helpful for identity fraud detection, as it offers an incremental and user-driven view of the data. We initially queried the account ending in 9460, and then expanded on the phone number.
Now we can see that several different accounts share the same phone number. That’s something unusual and worth investigating further.
Next, we expand on one of the new accounts added to our visualization.
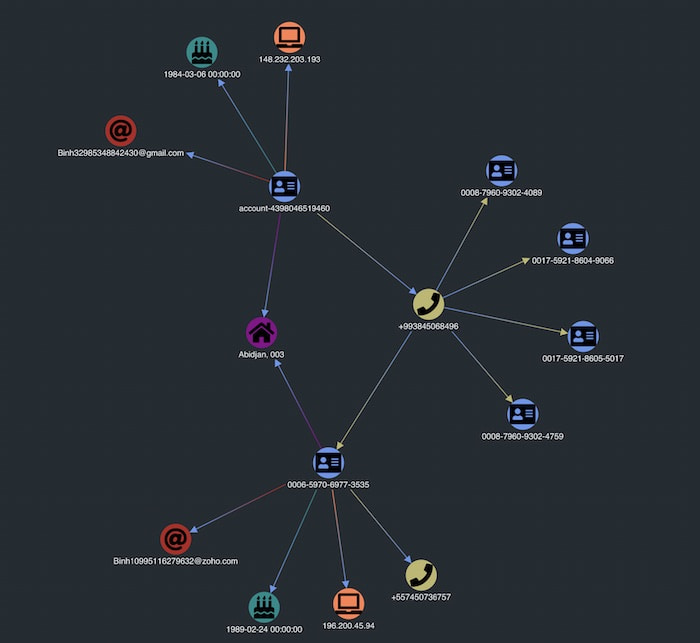
That account also shares a physical address with the initial account but has a different IP address. Does this suggest that someone is opening accounts fraudulently?
So far, we’ve focused on properties of accounts and not transactions. Our database contains every transaction between accounts and merchants, and you’ll remember that we ignored transactions in the previous steps. That’s because, in this sample database, transactions are modeled as nodes (vertices in Gremlin), but we want to think of them as links between accounts and merchants. For this we need a slightly different Gremlin query:
g.V(event.id).as('A')
  .bothE()
  .bothV().hasLabel('Transaction').as('T')
  .bothE()
  .bothV().hasLabel('Merchant', 'Account').as('M')
  .select('A','T','M')
  .by(__.valueMap(true))
  .path()
  .toList()
In this query, we take out an additional step and look at all transactions connected to the initial node, but then all merchants or accounts connected to that transaction. This way we can treat the transaction node in our database as a link in the identity fraud detection visualization.
We’ll need slightly different parsing logic here too:
        jsonData.forEach(element => {
          //in the array that gets returned, the 5th column has properties A, M, and
         //T, as we defined in our cypher query
            let merchantNode = element.objects[5].M;
            let accountNode = element.objects[5].A;
           let transactionLink = element.objects[5].T;
            if (!nodesInfo.some(e => e.id === accountNode.id)) {
               nodesInfo.push({id: accountNode.id, name: accountNode[visMap[accountNode.label].id][0], color: visMap[accountNode.label].color, fontIcon: visMap[accountNode.label].fontIcon});
           }
           //each transaction is unique, so we're not going to check for duplicates here
           if (merchantNode.id != accountNode.id) { //check for self-links
             linksInfo.push({id: transactionLink.id, id1: accountNode.id, id2: merchantNode.id, timestamp: new Date(transactionLink.created[0])});
           }
           if (!nodesInfo.some(e => e.id === merchantNode.id)) {
               //check if the merchant is already there
               nodesInfo.push({id: merchantNode.id, name: merchantNode[visMap[merchantNode.label].id][0], color: visMap[merchantNode.label].color, fontIcon: visMap[merchantNode.label].fontIcon })
           }
       });
We’ll also add the timestamp of the transaction as a property on the link. That way, we can add the data to KronoGraph – our timeline visualization tool – to see how sequences of events unfold:
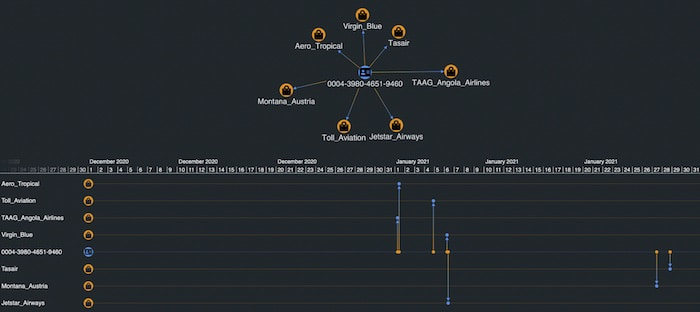
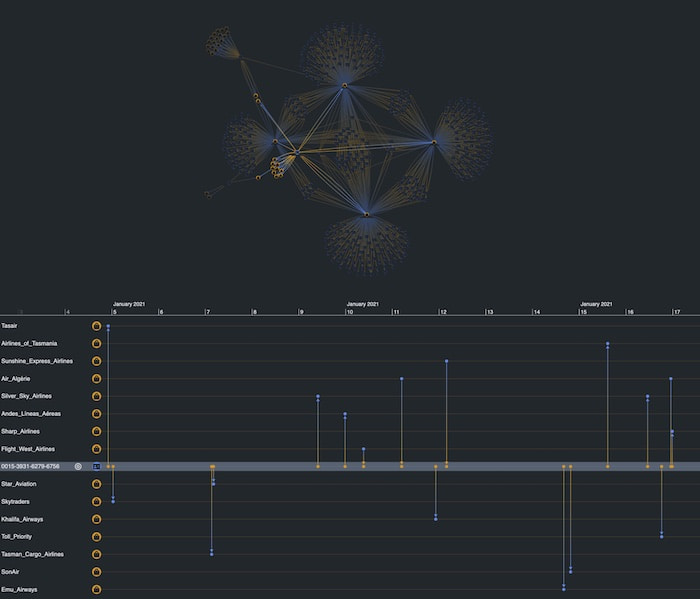
Now we have two complementary views of the same Neptune data – a KeyLines graph visualization chart at the top and a KronoGraph timeline below.
We see that our account ending in 9460 had transactions with the linked merchants over the course of January 2021. Let’s expand on the graph by double-clicking a merchant. This queries Neptune for all the transactions associated with that merchant, in this case, Jetstar Airways.
There are a lot of accounts, which is expected, but our KronoGraph timeline shows us when those transactions happened. Notice the unusual spike in activity on January 3rd.
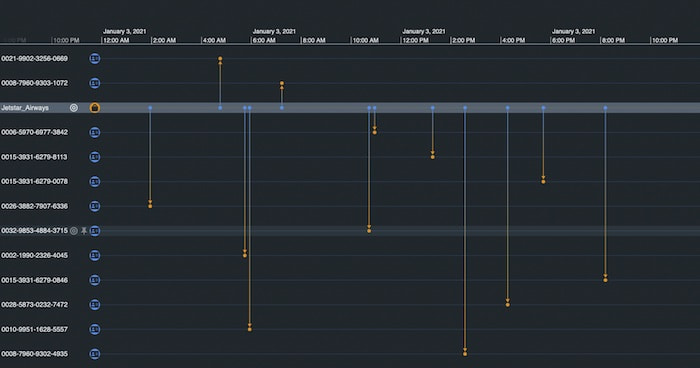
KeyLines and KronoGraph are wired together so that interacting with one adapts the view in the other. As we use KronoGraph to zoom into January 3rd, we also filter the KeyLines chart to show only the accounts which were active in that time window.
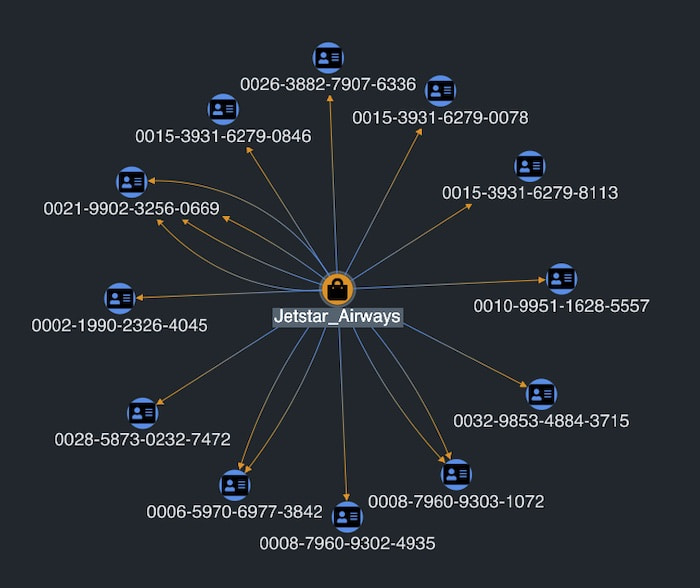
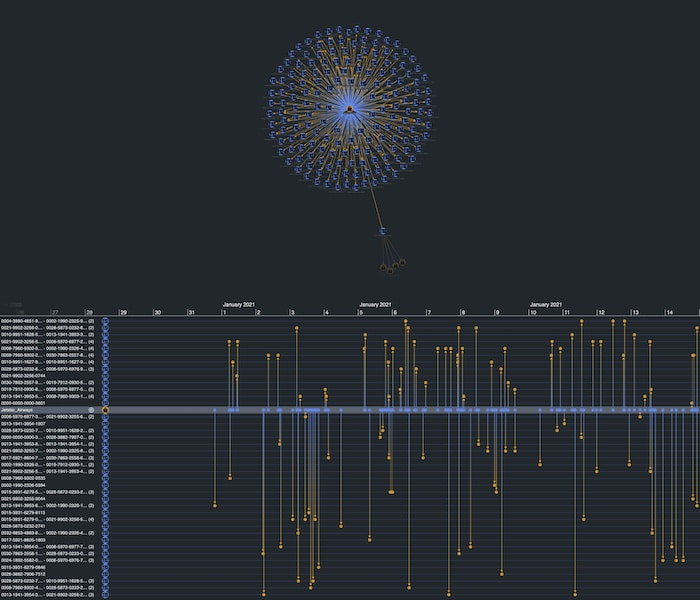
We can expand more merchants to reveal new insights. One account seems to be linked to a number of different airlines.

Selecting that account in the chart shows in the timeline that this account had transactions with fifteen airlines in the space of a single month, but not outside that range, and rarely with the same airline twice. In an identity fraud detection process, this would ring alarm bells. It resembles a typical fraud pattern where stolen cards are used within a short timeframe to purchase goods or services that don’t match the card holder’s usual activity.
Effective identity fraud detection apps use visualization
In this tutorial, we built an end-to-end identity fraud detection application for graph and timeline visualization using Amazon Neptune. We demonstrated how end users can look for any fraud use case without needing to learn technical details about how the data is structured or how to issue Gremlin queries.
To find out more about what you can achieve with our graph and timeline visualization toolkits, request a free trial.
Share: