We’ve seen significant interest in TigerGraph’s fast, scalable graph database platform recently. In response, I put together this TigerGraph tutorial to create a React graph visualization application that integrates with their cloud database.
Using one of TigerGraph’s sample datasets – featuring anonymized COVID-19 patient data – I’ll demonstrate how you can use our flexible ReGraph toolkit to visualize your TigerGraph data and find answers to complex queries fast.
About TigerGraph
![]()
Since its launch in 2017, TigerGraph’s graph analytics software has given analysts and data scientists the ability to go deep into their data and find the insights that power fast business decisions.
TigerGraph GraphDB is built on a distributed native graph database, with a SQL-like query language called GSQL, and integrated tooling that makes it a popular enterprise choice. TigerGraph Cloud is a more accessible version which is ideal for building proof-of-concept models. You can choose your own cloud platform, interact with their management studio application and take advantage of their REST interface.
We’ll use the cloud version in this TigerGraph tutorial, but the general approach should work with the enterprise version too.
We’ll also use TigerGraph’s sample graph dataset designed to detect COVID-19 hotspots and track the movements of potential spreaders. It features a few thousand records of anonymized COVID-19 patients together with details of their close contacts and travel events.
The aim of this TigerGraph tutorial is to create a ReGraph graph visualization application that instantly brings new and interesting data into a chart through intuitive user interactions. Here are the steps that’ll get us there:
- Create a new TigerGraph solution
- Populate the database with sample data
- Write and install a query using GSQL, TigerGraph’s query language
- Build a new ReGraph application & visualize query results
Create a new TigerGraph solution
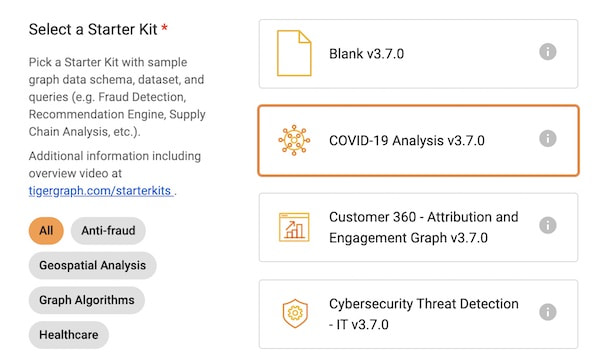
If you’re new to TigerGraph, the simplest way to get started is with one of their TigerGraph Cloud Starter Kits. I selected the COVID-19 Analysis graph schema and to work through the cloud, region and (free) instance options to create a named solution. If you need help, there’s a useful getting started with TigerGraph Distributed Cloud video.
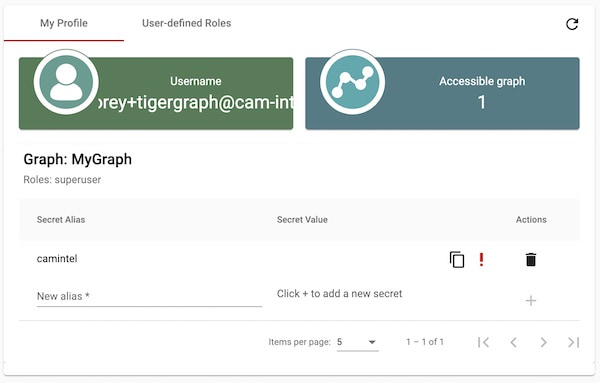
Once we’ve created the solution, we access TigerGraph’s Admin Portal, their browser-based DevOps tool, and configure the database. We follow their user management guide and create a superuser role for myself. We also generate a secret value:
The database contains a REST endpoint called /requesttoken that allows me to transmit the secret value which returns the authentication token. We use curl for this:
curl -X POST http://path_to_tg/requesttoken
     -d '{"secret":"SECRETGOESHERE", "graph":"MyGraph", "lifetime":"100000"}'
Here’s a sample response with a token that I’ll need for every future REST call.
{
  "code": "REST-0000",
  "expiration": 1616042814,
  "error": false,
  "message": "Generate new token successfully.nWarning: Tigergraph Support cannot restore access to secrets/tokens for security reasons. Please save your secret/token and keep it safe and accessible.",
  "token": "TOKEN_CODE"
}
With our solution set up and REST configured, the next step in our TigerGraph tutorial is to import the COVID-19 data.
Populate the database with sample data
TigerGraph’s GraphStudio™ provides a useful interface for application development tasks. We’ll give an overview of my interactions with it, but for detailed information, see the GraphStudio Docs.
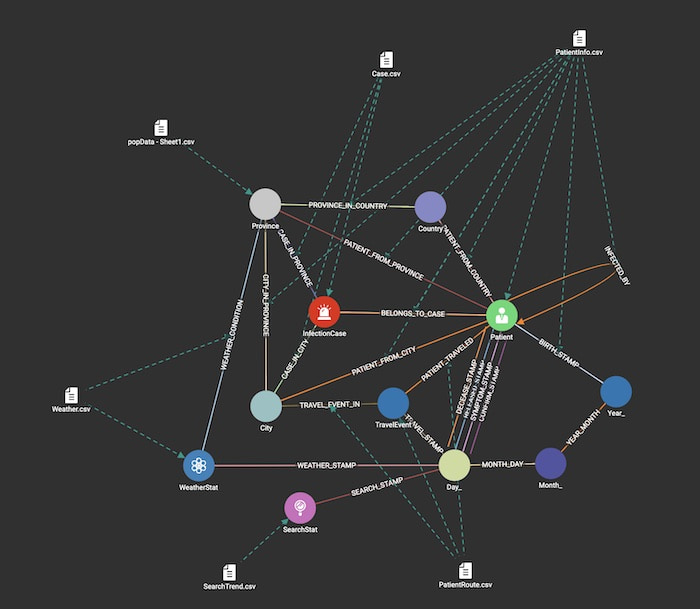
I log into GraphStudio with my Admin Portal credentials. Remember that the Starter Kit already includes the schema, complete with mappings to CSV files for every node and link type. But we still need to import the data from those files using GraphStudio’s Load Data tab.
Once I’ve loaded each CSV file, We have a working graph database, a REST interface and a basic visualization. For more advanced analysis of your TigerGraph data, applications built using our powerful data visualization toolkits provide the ideal solution.
Now we’ll create a database query that we can use in ReGraph.
Write and install a query
For ReGraph to visualize the data, we need to get it from the cloud-hosted database into the browser. TigerGraph has a dedicated REST interface for this – it’s possible to submit GSQL (TigerGraph’s SQL-like query language) in the REST call directly – but for security reasons, we choose a different way. We pre-register a query on the server side and then pass the name of that query along with a parameter from the browser.
TigerGraph GraphStudio’s Write Queries page lets you write and run custom GSQL queries.
We use one of the pre-built GSQL queries, allConnection, which takes a patient number and returns every link of any type to that patient, including other patients and travel events.
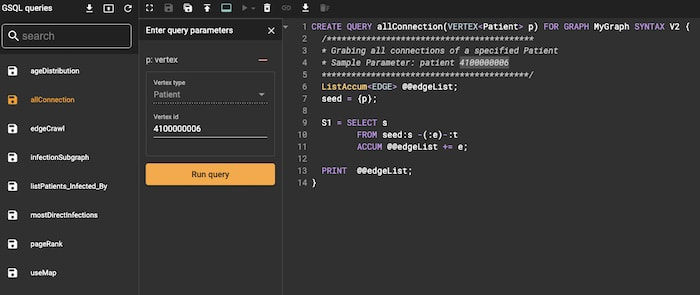
This query returns the results as an edgeList. This is perfect for my needs. Not only will the query bring in data for the initial page load in ReGraph, we can also use it to bring additional data into the chart on demand. We call this expanding: when a user double-clicks on a node it automatically adds that node’s connections to the chart so they explore the data interactively.
We also need to save the query with a name we’ll use to call it from the client side via REST, and then install it. To keep things simple, we use the suggested sample parameter, 4100000006 (patient number). This will be our first query when the ReGraph application loads.
Build a new ReGraph application & visualize query results
The easiest way to build a new ReGraph application is to use create-react-app. We’ve blogged about this before – see Getting started with ReGraph – so we’ll skip the details here.
That blog post gives us a working ReGraph application, but the data we need to load must be modified in app.js so we can execute a REST query.
Obtaining data from another source on a page will cause a Cross-Origin Resource Sharing (CORS) error in the browser. These can be difficult to solve, and the TigerGraph Cloud platform doesn’t allow you to authorize cross-side origins on the platform itself. To solve this, we created a proxy using the cors-anywhere open source tool, but that’s outside the scope of this post. Instead, we’ll assume that we’re submitting the REST queries directly to the endpoint itself.
We pass the token generated earlier to authenticate the HTTP GET – we’ll do it first with curl so we can see the result:
curl -X GET "https://cam-intel.i.tgcloud.io:443/restpp/query/MyGraph/allConnection?p=4100000006"

headers: {'Accept': 'application/json', 'Authorization': 'Bearer TOKEN_STRING_HERE'}


{
    "version": {
        "edition": "enterprise",
        "api": "v2",
        "schema": 0
    },
    "error": false,
    "message": "",
    "results": [{
        "@@edgeList": [{
            "e_type": "INFECTED_BY",
            "from_id": "4100000006",
            "from_type": "Patient",
            "to_id": "4100000007",
            "to_type": "Patient",
            "directed": true,
            "attributes": {}
        } … plus about 40 other items        }]
    }]
}
Now we need to parse through that @@edgeList array and convert the results into the simple JavaScript format ReGraph understands, together with custom style settings to create beautiful visualizations. We’ll do that in the parseData function below and create two nodes and a link between them for each edge in the array.
A few other things worth mentioning in this code:
- I’ve added code to load Font Awesome 6 fonts to create node icons for different item types. It means we can use real-world icons to give better context, such as the COVID icon for the infectious case node type.
- When the user double-clicks on a node, we run the expand function which collects the id of the node clicked on and passes that to the exact same query that we use when the page loads. It just adds the newly returned items to the existing chart instead of creating an entire chart from scratch.
import React, { useState, useEffect } from 'react';
import { Chart } from 'regraph';
import 'whatwg-fetch';
import '@fortawesome/fontawesome-free/css/fontawesome.css';
import '@fortawesome/fontawesome-free/css/solid.css';
import useFontFaceObserver from 'use-font-face-observer';

const ApiUrl = ({ nodeId }) => `https://cam-intel.i.tgcloud.io:443/restpp/query/MyGraph/allConnection?p=${nodeId}`;

const typeToFontIconColorMap = {
 Patient: {color: '#1ced11', fontIcon: 'fa-user-injured'},
 City: {color: '#3c2deb', fontIcon: 'fa-city'},
 Province: {color: '#be2deb', fontIcon: 'fa-earth-asia'},
 Country: {color: '#ebb52d', fontIcon: 'fa-flag'},
 TravelEvent: {color: '#fa344f', fontIcon: 'fa-plane-departure'},
 InfectionCase: {color: '#6e6347', fontIcon: 'fa-virus-covid'},
 Year_: {color: '#6e6347', fontIcon: 'fa-calendar'}
}

const parseData = (response) => {
 //add node to new data
 let newData = {};
 response.results[0]['@@edgeList'].forEach(singleEdge => {
   newData[singleEdge.from_id] = {
     label: {text: singleEdge.from_id, center: false},
     color: typeToFontIconColorMap[singleEdge.from_type].color,
     fontIcon: {text: typeToFontIconColorMap[singleEdge.from_type].fontIcon,
       color: 'rgb:10,15,10'} };
   newData[singleEdge.from_id + '->' + singleEdge.to_id] = {id1: singleEdge.from_id, id2: singleEdge.to_id};
   newData[singleEdge.to_id] = {
     label: {text: singleEdge.to_id, center: false},
     color: typeToFontIconColorMap[singleEdge.to_type].color,
     fontIcon: {text: typeToFontIconColorMap[singleEdge.to_type].fontIcon,
       color: 'rgb:10,15,10'}
   };
 });
 return newData;
}
const fetchData = async (url) => {
 const result = await fetch(url, {method: 'GET', headers: {'Accept': 'application/json', 'Authorization': 'Bearer TOKEN_STRING_HERE'}});
 return result.json();
};

export const Demo = () => <Fetch />;

function Fetch() {
 const isFontListLoaded = useFontFaceObserver([{ family: 'Font Awesome 6 Free' }]);
 const [items, setItems] = useState({});

 useEffect(() => {
   const initialUrl = ApiUrl( {nodeId: '4100000006'}) //The example patient we'll start with when the page loads
   fetchData(initialUrl).then((response) => setItems(parseData(response)));
 }, []);

 async function expand({ id }) {
   //id will be null if the user double-clicked on something that isn’t a chart item
   //and if it has a id1 property, it’s a link, so we want to do nothing
   if (id == null || items[id].id1) {
     return;
   }
   const { text } = items[id].label;
   const url = ApiUrl({ nodeId: text }); //use the label we clicked on to form the basis of the new query
   const data = await fetchData(url);
   const parsedItems = parseData(data)
   //convert the data to the ReGraph format
   setItems({...parsedItems, ...items}); //add the new items to the set of existing items
 }

 return (
  <div>
   {isFontListLoaded && (
   <Chart
     style={{ flex: 1, height: '100pc', width: '100pc' }}
     animation={{ time: 1000 }}
     items={items}
     options={{
       iconFontFamily: 'Font Awesome 6 Free',
       labels: { maxLength: 20 },
     }}
     onDoubleClick={expand}
   /> )}
   <div>
 );
}

export default Fetch;
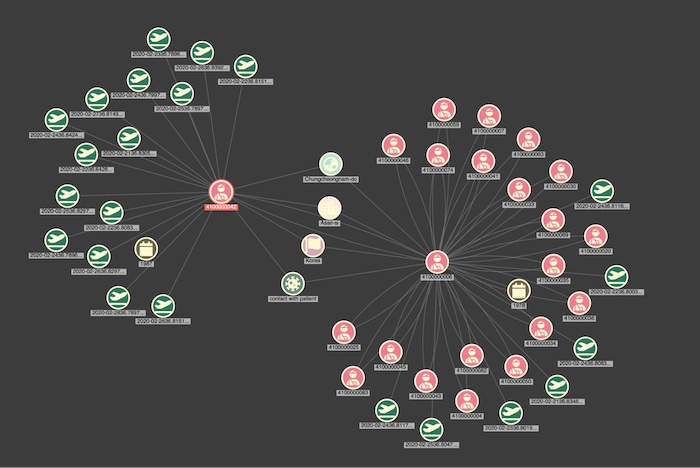
When we run the application, we get patient 4100000006 and their connections:
And when we choose another patient to expand on (4100000042, in this case), their connections are added to the existing graph.
Try advanced graph visualization with ReGraph
This TigerGraph tutorial has shown how to build a working ReGraph application that draws data from a TigerGraph database. You can take it much further by adding new elements such as advanced network filtering, clever node groupings and complex graph algorithms. You can also keep adding queries or data sources – the advantages to using our toolkit approach are almost limitless.
If you’re using TigerGraph and want a flexible UI framework to visualize your data in an interactive web application, request a free trial of ReGraph to get started.
Share:
