In this Puppeteer tutorial, I’ll show you how to create a simple server application using the Puppeteer library with KeyLines.
KeyLines and ReGraph, our graph visualization toolkits, include a high-res export function so your users can share visualizations as images or customized PDF summaries. It means that applications built with our toolkits can deliver quick and clear digital or printed exports that don’t compromise on image quality.
But what if you’re working offline, on a local server? Our libraries usually run in your browser so that they can do things like handle new fonts, and measure the size of the text and font icons in your charts.
With the right API, you can run KeyLines or ReGraph in a virtual Chrome browser, and generate high-res exports whenever you need them. To start, let’s take a closer look at the API we’ll use: Puppeteer.
About Puppeteer
Puppeteer is an open-source Node.js library developed by Google. It helps automate and simplify development with a high-level API that lets you control headless Chrome over the DevTools Protocol.
It’s a useful tool that can help you write and maintain simple and automated tests in your application using headless Chrome or Chromebit devices, with no need for any browser extensions.
Creating a KeyLines application that works with Puppeteer
In this Puppeteer tutorial we use KeyLines, but the same method applies if you’re using ReGraph. We’ll also use:
- NodeJS, 18.7.0 with NPX 6.4.15
- Yarn version 1.22.18
- curl 7.79.1
Other versions of these tools might give different results. We’ll use other tools too, installed via Yarn.
Writing our node application
Before we can automate our application, we need to write it. Here’s what we want it to do:
- Create a full-screen chart that incorporates our entire visualization
- Expose a function on the window-object to load chart data and options (this allows Puppeteer to steer the app)
- Create a high-res export of the fully-loaded chart
To achieve this, our first step is to run:
mkdir headless-keylines
cd headless-keylines
yarn init -y
Then we copy our KeyLines package into the directory and install it via: yarn add file:./keylines-6.11.0-2782991466.tgz
Next we extract the files linked to our chart to a new directory called public/:
tar -zxf keylines-6.11.0-2782991466.tgz keylines-6.11.0-2782991466/pdf/
mv keylines-6.11.0-2782991466/ public/
ln -s ../node_modules/keylines/ public/
Creating a chart
With all the dependencies extracted, installed and linked, we’re ready to build our chart. Create the file public/index.html with the following contents:
<!DOCTYPE html>
<html>
    <head>
        <meta charset="UTF-8" />
        <script type="text/javascript" src="/pdf/pdfkit.standalone.cjs"></script>
        <script type="text/javascript" src="/pdf/blob-stream.cjs"></script>
        <script type="text/javascript" src="/pdf/svg-to-pdfkit.cjs"></script>
        <style type="text/css">
            * {
                margin: 0;
                padding: 0;
            }
        </style>
    </head>
    <body>
        <div id="kl" style="width: 100vw; height: 100vh"></div>
    </body>
    <script type="module">
        import KeyLines from "/keylines/esm/index.js";

        const container = "kl";

        const data = {
            type: "LinkChart",
            items: [{ id: "id1", type: "node", c: "#43976C", x: 150, y: 150, t: "Hello World" }],
        };

        KeyLines.paths({ images: "/keylines/images/" });
        KeyLines.promisify();
        const chart = await KeyLines.create({ container });
        await chart.load(data);
    </script>
</html>
Previewing our app
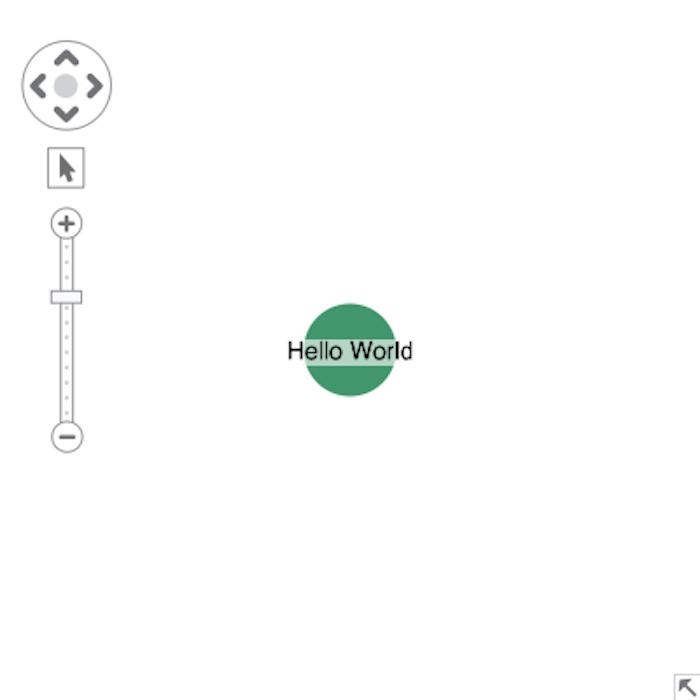
If we use the command npx serve public/ we should see this chart – a single node labelled “Hello World”:
Now that we’ve got KeyLines running in our browser, we write a function that loads a chart with data and includes details about how to configure it. Replace the contents of the <script type=”module”> tag with:
<script type="module">
    import KeyLines from "/keylines/esm/index.js";

    const container = "kl";

    KeyLines.paths({ images: "/keylines/images/" });
    KeyLines.promisify();

    let chart;

    globalThis.load = async function load({ data, options }) {
        if (chart) {
            chart.destroy();
            chart = null;
        }

        chart = await KeyLines.create({ container, options });
        await chart.load(data);
    };
</script>
To test the function, we reload the page and run the following from Chrome’s DevTools:
window.load({
    data: {
        type: "LinkChart",
        items: [{ id: "id1", type: "node", c: "#43976C", x: 150, y: 150, t: "Hello World" }],
    },
});
When we load the page for the first time, we see a blank screen. Once we run the window.load-function, we see the same “Hello World” chart as before.
Creating and downloading our export
Finally, we can add a call to chart.export at the end of the function to support our high-res export. To do this, update the load function:
async function load({ data, options, export: exportOpts }) {
    // See code above...

    const { url } = await chart.export(exportOpts);
    const anchor = document.createElement("a");
    anchor.href = url;
    anchor.download = "chart";
    anchor.click();

    URL.revokeObjectURL(url);
}
Once we save the file and reload it, we run window.load again. This time we also pass in an export-object. This creates a new chart. Once it’s loaded, the app creates and downloads an export of the new chart automatically.
window.load({
    data: {
        type: "LinkChart",
        items: [{ id: "id1", type: "node", c: "#43976C", x: 150, y: 150, t: "Hello World" }],
    },
    export: { type: "pdf" },
});
Automating the KeyLines application using Puppeteer
Now that our KeyLines application is running smoothly, we can bring Puppeteer in to drive it automatically. First we’ll install it with: yarn add puppeteer
Next we’ll create a new file and directory: src/browser.mjs
And add this content:
import { launch } from "puppeteer";

// Launch a new browser, for the time being it will have a window so we can see what is happening
const browser = await launch({ headless: false });
// Create a new tab in the browser we just launched
const page = await browser.newPage();
// Go to our KeyLines application (should still be running through `npx serve public/`)
await page.goto("http://localhost:3000");
We can now run this code via node src/browser.mjs. This opens a new Chrome instance that navigates to our app (we’ll see it because we set headless: false).
Now that we know our script can load our KeyLines app, we can automate it. For this we use page.evaluate to call the load-function we exposed on the window-object.
When we add the following code and run node src/browser.mjs again, a file “chart” appears in the “Downloads” directory of our system (e.g. ~/Downloads on MacOS).
await page.evaluate(() => {
    return window.load({
        data: {
            type: "LinkChart",
            items: [{ id: "id1", type: "node", c: "#43976C", x: 150, y: 150, t: "Hello World" }],
        },
        export: { type: "pdf" },
    });
});
To avoid cluttering our “Downloads” directory, we configure Puppeteer to use a temporary directory for its downloads.
First we import mkdtemp from the “fs” module, tmpdir from the “os” module and join from the path module.
Then we create a “CDPSession” class to communicate directly with the Chrome DevTools used by Puppeteer. To do this, we call: page.target().createCDPSession().
Finally we need to send the Page.setDownloadBehavior command to Chrome DevTools:
import { mkdtemp } from "node:fs/promises";
import { tmpdir } from "node:os";
import { join } from "node:path";
import { launch } from "puppeteer";

//
// Code to generate the browser...
//

const client = await browser.target().createCDPSession();
// Create a temporary directory
const downloadPath = await mkdtemp(join(tmpdir(), "download-"));
// Set download location and enable events to track the download progress.
await client.send("Browser.setDownloadBehavior", {
    behavior: "allow", // Allows downloads without any user interaction
    downloadPath,
    eventsEnabled: true, // Allows us to track downloads via events
});

//
// Code to open and drive the KeyLines application...
//

console.log(`Downloaded file to "${downloadPath}".`);
Running the script again should now log out something like:
Downloaded file to “/var/folders/g2/lwmc82xx7rvfs9m6hv4hq6mw0000gn/T/download-ghqAYR”.
When we open this path in our system’s file browser, we should find a single “chart.pdf”. It’s important to make sure the browser stays open after the download is finished. This allows the script to keep running after the download.
Unfortunately, that’s not as easy as just running browser.close() because it might close the browser before the download is complete. The best way to keep track of the running downloads is to use the Chrome DevTools Browser.downloadWillBegin and Browser.downloadProgress:
// Code to generate the page...

const pendingDownloads = new Promise((resolve) => {
    let runningDownloads = 0;
    client.on("Browser.downloadWillBegin", () => {
        runningDownloads += 1;
    });

    client.on("Browser.downloadProgress", ({ state }) => {
        if (state === "completed" || state === "canceled") {
            runningDownloads--;
        }

        if (runningDownloads === 0) {
            resolve();
        }
    });
});

//
// Code to open the application and start the exports...
//

// Wait for all started downloads to finish
await pendingDownloads;
// Close the browser
await browser.close();

console.log(`Downloaded file to "${downloadPath}".`);
Parameterizing the script
At this stage in our Puppeteer tutorial, our automation can only create one simple graph. To create new graphs and exports, we need a function that accepts a list of items, chart and export options, similar to the function we used in our Keylines application.
We wrap our code in a function that accepts a single parameter “params” and forward it to the KeyLines application:
export async function download(params) {
    const browser = await launch();
    const client = await browser.target().createCDPSession();
    const downloadPath = await mkdtemp(join(tmpdir(), "download-"));
    await client.send("Browser.setDownloadBehavior", {
        behavior: "allow",
        downloadPath,
        eventsEnabled: true,
    });

    const pendingDownloads = new Promise((resolve) => {
        let runningDownloads = 0;
        client.on("Browser.downloadWillBegin", () => {
            runningDownloads += 1;
        });

        client.on("Browser.downloadProgress", ({ state }) => {
            if (state === "completed" || state === "canceled") {
                runningDownloads--;
            }

            if (runningDownloads === 0) {
                resolve();
            }
        });
    });

    const page = await browser.newPage();
    await page.goto("http://localhost:3000");

    await page.evaluate((params) => {
        return window.load(params);
    }, params);

    await pendingDownloads;
    await browser.close();

    return downloadPath;
}
Next we check that our script works. In the node REPL, run:
const { download } = await import("./src/browser.mjs");
const dir = await download({
    data: {
        type: "LinkChart",
        items: [{ id: "id1", type: "node", c: "#43976C", x: 150, y: 150, t: "Hello World" }],
    },
    export: { type: "pdf" },
});
console.log(dir);
This prints a path to a directory where we find a new “chart.pdf”.
Turning the script into a standalone service
Now we have a program that generates exports and can expose this functionality as an HTTP POST endpoint. For this we create a small express server which will run our KeyLines application, independently of our existing server.
First we add express to our application: yarn add express
Next we create src/app.mjs that will serve the KeyLines application:
import { dirname, resolve } from "node:path";
import { fileURLToPath } from "node:url";
import express from "express";

// Dir the current file is located in.
const __dirname = dirname(fileURLToPath(import.meta.url));
const publicPath = resolve(__dirname, "../public");

const app = express();

// Serve the KeyLines application by default
app.use(express.static(publicPath));

export default app;
After we create app.mjs we add src/index.mjs to load the app and run a server on port 3000:
import app from "./app.mjs";

const port = 3000;

app.listen(port, () => {
    console.log(`App listening on port ${port}`);
});
Now, when we run node src/index.mjs and open the page, we see our KeyLines application. Make sure you end the “npx serve”-process first, if it’s still running.
To check it works, we run it to create a chart and start a test download:
window.load({
    data: {
        type: "LinkChart",
        items: [{ id: "id1", type: "node", c: "#43976C", x: 150, y: 150, t: "Hello World" }],
    },
    export: { type: "pdf" },
});
With the KeyLines application working, we need to expose a way of triggering the download-function we wrote earlier. We do this by exposing a POST-endpoint on / that accepts the function’s parameters as a JSON payload.
For this we add code to src/app.mjs:
//
// Other imports...
//

import { join } from "node:path";
import { download } from "./browser.mjs";

//
// Code to set up constants
//

// Parse JSON payload on a request's body
app.use(express.json());
app.post("/", async (request, response) => {
    const { body } = request;

    let { export: exportOpts, ...params } = body;
    if (typeof exportOpts !== "object" || exportOpts == null) {
        // Set default export opts if none or invalid options where supplied
        exportOpts = { type: "pdf" };
    } else if (["pdf", "png", "jpeg", "svg"].includes(exportOpts.type)) {
        // Reset the type if the export options did not include a valid type
        exportOpts.type = "pdf";
    }

    const dir = await download({ ...params, export: exportOpts });
    const path = join(dir, `chart.${exportOpts.type}`);

    // Send the generated export to the user
    response.download(path);
});

//
// Code to expose the KeyLines application...
//
Finally, we start the server via node src/index.mjs. (If it was still running – stop it first.)
We run a curl command to do a final test on our app. This should send our “Hello World” node to the server, and start a download of the generated file.
curl
  -X POST
  -H "Content-Type: application/json"
  -d '{
    "data": {
        "type": "LinkChart",
        "items": [{ "id": "id1", "type": "node", "c": "#43976C", "x": 150, "y": 150, "t": "Hello World" }]
    },
    "export": { "type": "pdf" }
  }'
  http://localhost:3000
  -o chart.pdf
Now we can open the “chart.pdf” file and share it anywhere in the world.
Taking it further
This Puppeteer tutorial shows you how to export a basic chart, but you can customize your visualizations with images, new fonts, font icons and more.
To give it a try with your own data, simply request a free trial.
Share: