In this SolidJS tutorial, I’ll show you how to create a simple web app using this lightweight React-like framework with KeyLines, our graph visualization toolkit. And with the Formula One World Championship season underway, we’ll use sample data of past F1 drivers’ champions to showcase our KeyLines and SolidJS integration.
SolidJS – the “deceptively simple” UI library
![]()
The State of JavaScript 2022 survey ranked SolidJS as the top front-end framework for user retention, and the third most popular framework they want to learn.
It is attractive to developers because it’s simple, high-performing, powerful and reactive. The supporting documentation, guides and tutorials make for an easy learning curve. It also compiles code to vanilla JavaScript, making it easy to integrate with KeyLines – our SDK for embedding interactive network visualization inside your web apps. Let’s follow the four-step SolidJS tutorial to see how.
1. Create a SolidJS app
Let’s set up a small SolidJS app. We follow the first steps of SolidJS’s getting started tutorial to create a JavaScript-based application.
npx degit solidjs/templates/js solid-KeyLines
cd solid-KeyLines
pnpm install
Once the app is bootstrapped, we run the following command to start the development server:
pnpm dev
2. Add KeyLines
With SolidJS up and running, let’s add KeyLines to our app.
Once your free trial request is granted, download KeyLines from the SDK site, then add it to your app by running:
pnpm add ./KeyLines-#.#.#-##########.tgz
We’ll add a very basic KeyLines chart to our app. Replace the contents of src/App.jsx with:
import KeyLines from "KeyLines";
import { onMount } from "solid-js";

function App() {
    // Reference to the HTML element in which the chart will be inserted
    let container;

    onMount(async () => {
        // Create a KeyLines chart in the `container` HTML element
        const chart = await KeyLines.create({ type: "chart", container });

        // Load data into the chart
        await chart.expand(
            { type: "node", id: "n", t: "Hello SolidJS", c: "#446b9e", e: 5 },
            { layout: { fit: true } }
        );
    });

    // Render the container
    return <div style={{ height: "100vh" }} ref={container} />;
}

export default App;
This code creates a KeyLines chart that displays a single node with the label “Hello SolidJS”. Once you save the file, the web browser should reload and show you the chart.
3. Make the visualization interactive
With our basic KeyLines chart up and running, let’s add some interactivity.
Remember we’re visualizing data about F1 world drivers’ champions, so:
- nodes represent drivers, chassis constructors, engine constructors and tyre brands
- each link represents a single win
To start, we’ll load the data into the chart. Add the following code to your App.jsx file:
// Imports from above...

function App() {
    // Defining the container reference...

    onMount(async () => {
        // Create a KeyLines chart in the `container` HTML element
        const chart = await KeyLines.create({ type: "chart", container, options });

        // Load items into the chart
        await chart.expand(items, { layout: { fit: true } });
    });

    // Render the container...
}
After you save the file, the page reloads to give us a first look at our data. The initial chart will look quite basic until you add custom styling, which I’ve done in this example:
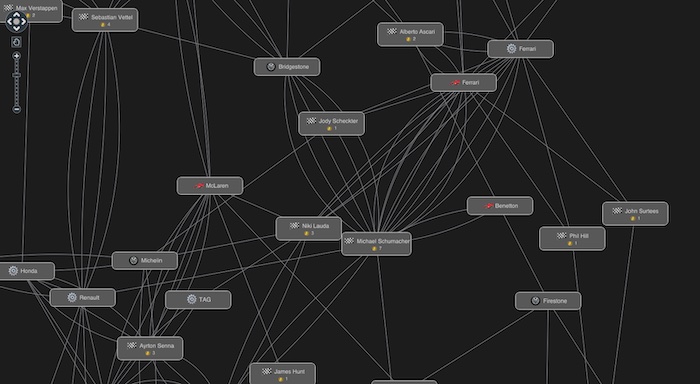
Visualizing the F1 World Drivers’ Champions data in our KeyLines & SolidJS tutorial
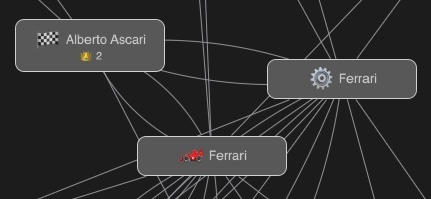
Notice the node designs we’ve used here, with rectangular shapes and custom decorations to make them more informative and distinctive. To learn more about advanced node design made easy, see 4 API functions that’ll revolutionize your graph design
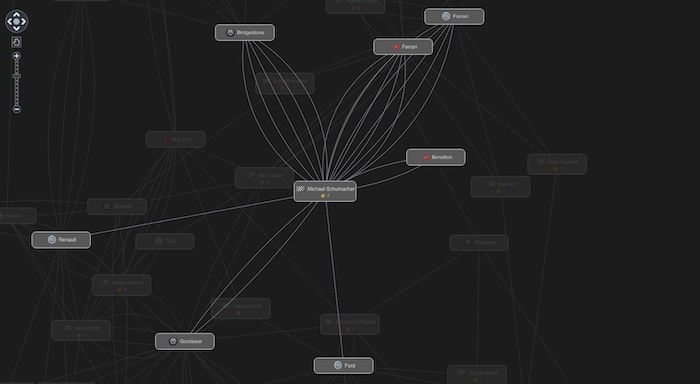
Next we’ll add some interactivity. Let’s highlight linked items when a node is selected. At the end of the onMount function, add:
// Create chart and load items...

chart.on("selection-change", () => {
    const selection = chart.selection();
    if (selection.length === 0) {
        chart.foreground(() => true);
        return;
    }

    const { nodes, links } = chart.graph().neighbours(selection);
    chart.foreground(({ id }) => {
        return selection.includes(id) || nodes.includes(id) || links.includes(id);
    });
});
After you save the file, select a node to highlight it and its neighbors. Here we click on seven-times champion driver Michael Schumacher to reveal the constructors and tyre manufacturers that helped him to success.
We didn’t have to use SolidJS functions or data-binding for this. KeyLines provides everything we need by default and manages the data internally.
4. React to external changes
We want to sync changes coming from outside KeyLines, such as user interactions with buttons. To keep track of them we’ll use a SolidJS signal.
Let’s add a dark mode switch to our app that changes the item colors:
function App() {
    // Reference to the HTML element in which the chart will be inserted
    let container;

    // Reference to the chart. Will be set during the `onMount` hook
    let chart;

    // Signal to keep track of the current theme
    const [theme, setTheme] = createSignal("dark");

    onMount(async () => {
        // Create a KeyLines chart in the `container` HTML element
        chart = await KeyLines.create({ type: "chart", container, options });

        // Load data into the chart and set up the `selection-change` event.
    });

    // Handler called when the switch mode button is clicked
    function switchTheme() {}

    // Render the container
    return (
        <div style={{ height: "100vh", display: "flex", "flex-direction": "column" }}>
            <button onClick={switchTheme}>Switch Theme</button>
            <div style={{ "flex-grow": 1 }} ref={container} />
        </div>
    );
}
With the button added and the chart exposed outside of onMount, let’s implement the switchTheme function:
function switchMode() {
    // Select the next theme based on the current value of the `theme` signal.
    const nextTheme = theme() === "dark" ? "light" : "dark";
    // Select the right colors for the text, the node and the chart's background based on the next
    // theme.
    const [foregroundColor, backgroundColor, backColour] =
        nextTheme === "light" ? ["black", "white", "#696969"] : ["white", "black", "#343434"];

    // Read all nodes out of the chart and keep track of those.
    const items = [];
    chart.each({ type: "node" }, (node) => {
        items.push({ id: node.id, c: backgroundColor, fc: foregroundColor });
    });
    // Apply new item properties to the chart. Notice that we use the `chart` reference created during
    // `onMount`
    chart.setProperties(items);
    chart.options({ controlTheme: nextTheme, backColour });
    // Finally update the theme signal
    setTheme(nextTheme);
}
In this code we created a switchTheme function that toggles the current theme between “dark” and “light”. It does the following:
- selects the right colors for the text, nodes, and chart background based on the nextTheme
- reads nodes out of the chart and keeps track of them
- applies new item properties to the chart and updates the theme signal
That’s all we need to do to get our SolidJS and KeyLines app to react to state changes.
The best JavaScript libraries for your web app
In this SolidJS tutorial we built a simple yet powerful visualization app.
Whatever third-party JavaScript library you prefer, you can integrate seamlessly with KeyLines. There’s a fully-documented API of functionality including real-time, dynamic and geospatial network support. Our documentation is easy to follow and features example source code. And if you need help with your integration, the developers that built the SDK provide expert support.
Tempted to try KeyLines for yourself? Request a free evaluation today
Share:
