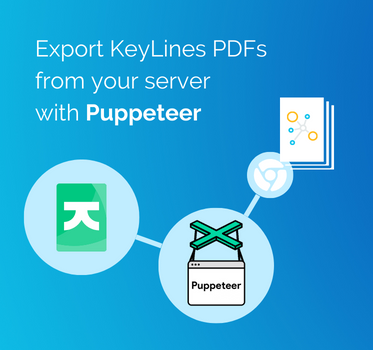
Puppeteer tutorial: create a graph visualization app in minutes
Christian Lentfort Developer
14th February, 2023 | 11 min read
In this Puppeteer tutorial, developer Christian Lentfort shows you how to create a simple server application using...
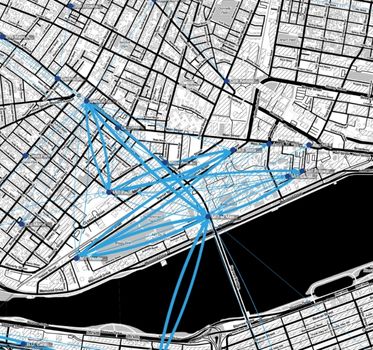
Geospatial data visualization with ReGraph and RedwoodJS
Christian Lentfort Developer
13th September, 2022 | 13 min read
We bootstrapped RedwoodJS to ReGraph, our data visualization toolkit for React developers, to build an app that...
Technical tutorial: using ReGraph in a Remix app
Christian Lentfort Developer
15th February, 2022 | 5 min read
In this technical tutorial for developers, we’ll show you how to get ReGraph running smoothly in Remix, a...
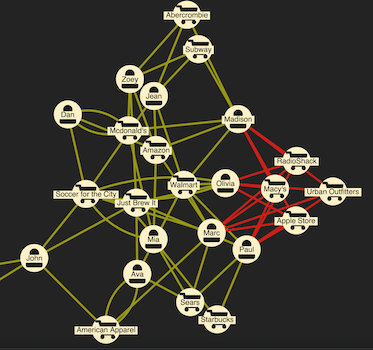
Styled Components tutorial for graph visualizations
Christian Lentfort Developer
13th July, 2021 | 10 min read
Follow this Styled Components tutorial to build a React graph visualization app with themes from the...
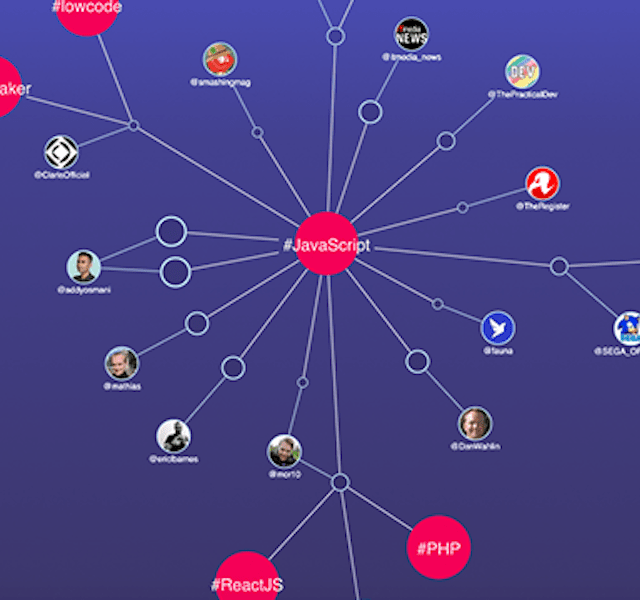
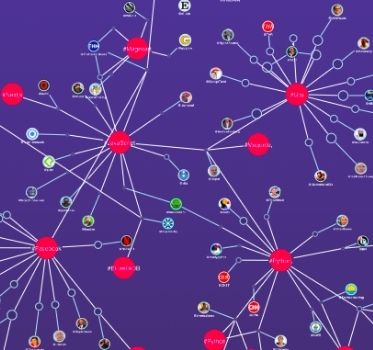
The big data challenge: visualizing Twitter with ReactJS & GraphQL
Christian Lentfort Developer
1st September, 2020 | 13 min read
Our toolkits help you visualize big data. Follow this guide to integrate ReGraph – our toolkit for building...
