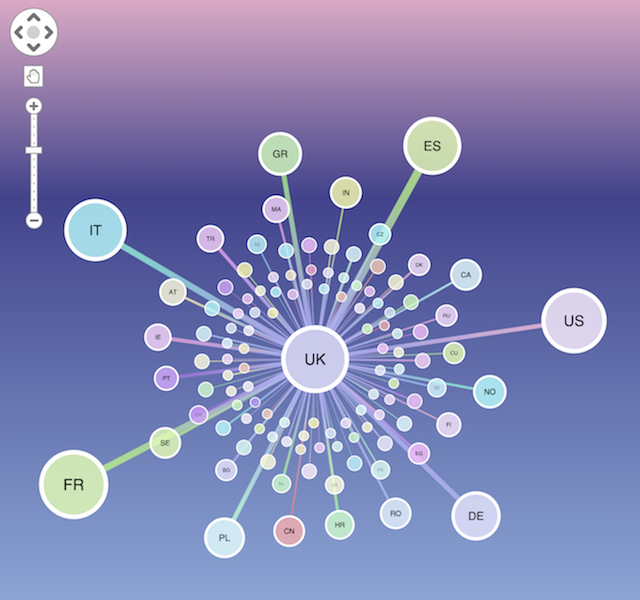
Leveraging the AWS stack with ReGraph
Ellen Cato European Sales Manager
18th August, 2025 | 8 min read
How to visualize graph data using the Amazon Neptune graph database and ReGraph, a React toolkit for graph...
Ellen Cato European Sales Manager
18th August, 2025 | 8 min read
How to visualize graph data using the Amazon Neptune graph database and ReGraph, a React toolkit for graph...

Bonney O'Hanlon Product Manager
7th February, 2023 | 6 min read
We explore map data visualization: what it is, what it’s for, and why you need it if you’re serious about...

Christian Lentfort Developer
13th September, 2022 | 13 min read
We bootstrapped RedwoodJS to ReGraph, our data visualization toolkit for React developers, to build an app that...
Christian Miles VP of Sales
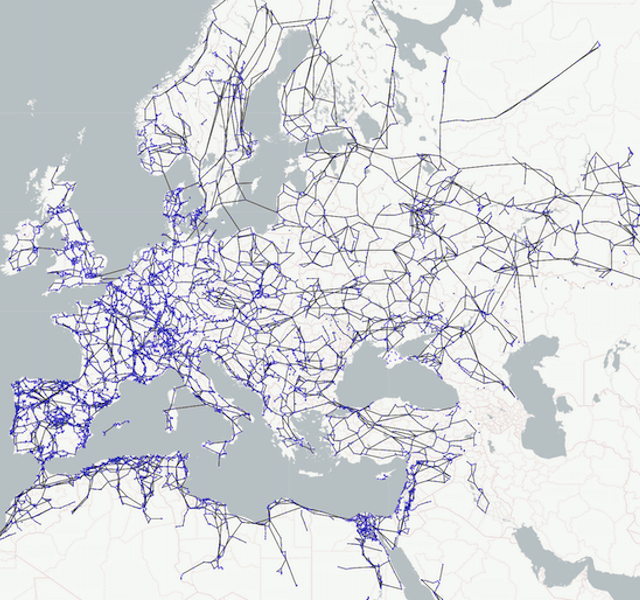
4th August, 2020 | 11 min read
We explore the fascinating world of energy infrastructure by visualizing the network of energy pipelines routing...
Registered in England and Wales with Company Number 07625370 | VAT Number 113 1740 61
6-8 Hills Road, Cambridge, CB2 1JP. All material © Cambridge Intelligence .
Privacy Policy | Security Framework
