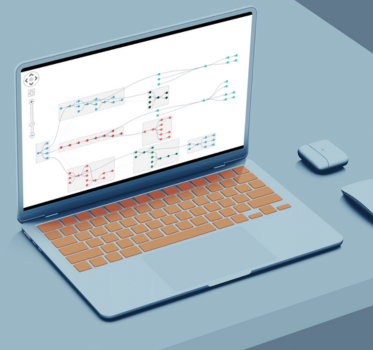
Tailwind CSS tutorial for graph visualization
Ivan Krushkov Commercial Development Lead
16th December, 2025 | 12 min read
In this Tailwind CSS tutorial, we’ll show you how to customize your ReGraph app and achieve the designs you want...
Ivan Krushkov Commercial Development Lead
16th December, 2025 | 12 min read
In this Tailwind CSS tutorial, we’ll show you how to customize your ReGraph app and achieve the designs you want...
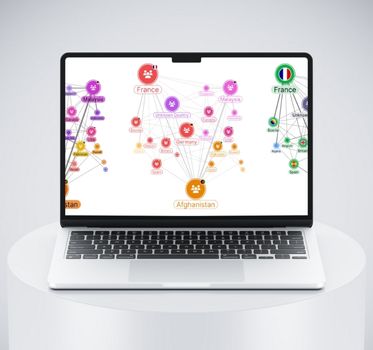
Ryan Shimmon Commercial Software Developer
18th November, 2025 | 8 min read
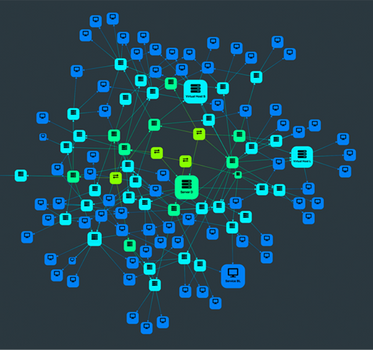
Use the Elastic UI framework (EUI) to build an interactive graph visualization app that looks good and is ready to...
Zach Mason Product Designer
24th June, 2025 | 18 min read
We share expert graph visualization UX principles that make the difference between user frustration and...
Courtney Collins Product Manager
10th January, 2025 | 6 min read
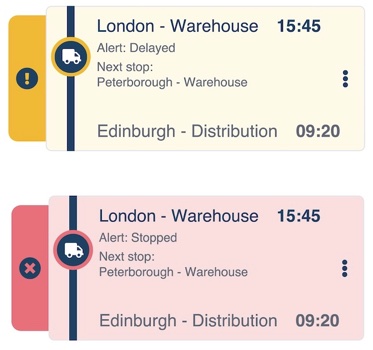
The way you represent relationships between nodes can make or break your link visualization. The link styles you...
Courtney Collins Product Manager
5th March, 2024 | 2 min read
The latest versions of KeyLines and ReGraph, our graph visualization SDKs, include two hotly-anticipated...
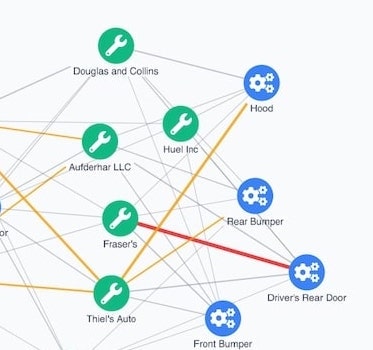
Ivan Krushkov Commercial Development Lead
9th August, 2023 | 8 min read
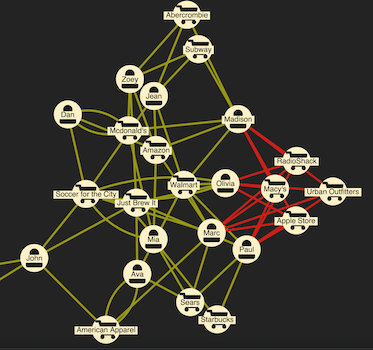
In this post, I show how easy it is to design a visual supply chain that’s customized to your users’ needs,...
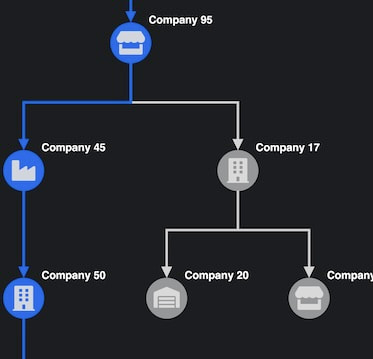
Kevin Naughten Senior Product Manager
2nd December, 2022 | 10 min read
Bring the perfect graph visualization design to life: our KeyLines and ReGraph SDKs offer almost infinite...
Christian Lentfort Developer
13th July, 2021 | 10 min read
Follow this Styled Components tutorial to build a React graph visualization app with themes from the...
Kevin Naughten Senior Product Manager
15th June, 2021 | 8 min read
Interactive graph visualization just got easier! These 4 examples show how to customize hover and select behavior...
Registered in England and Wales with Company Number 07625370 | VAT Number 113 1740 61
6-8 Hills Road, Cambridge, CB2 1JP. All material © Cambridge Intelligence .
Privacy Policy | Security Framework
