
In this tutorial, we use the Elastic UI framework (EUI) to build an interactive ReGraph graph visualization application that looks good and is ready to use in minutes.
About the Elastic UI framework
Many of our customers combine graph and timeline visualization capabilities with the powerful Elastic Stack. It gives users the ability to search and analyze data from any source in a reliable and secure way. Our Elasticsearch graph visualization tutorial has helped many get started with their core search technology.
![]()
Elastic UI is the design library behind the Elastic Stack. Made up of UI React components, it’s proving to be a flexible and customizable approach, with a strong focus on accessibility and excellent documentation. It means developers don’t need to spend time designing templates, choosing color themes, building UI components, etc. Elastic UI takes care of that for them.
We created ReGraph with developers in mind, too. Once connected to a data source, it takes care of rendering and animations to create a customizable, fully-interactive graph visualization. And in turn, end users benefit from a carefully-designed application with an intuitive interface and beautiful styling.
Using Elastic UI and ReGraph together, you can get a slick React-based graph application running in minutes. Here’s how.
Build a React application
Vite is a great way to get a single-page React application running with a single command. It takes care of all the configuration and dependencies so you can get on with writing code for your application.
In a new folder, run:
yarn create vite my-app --template react
After navigating to the project folder, run:
yarn dev
This loads a basic React application in a tab in your browser @localhost:5173.
Elastic UI requires React version 18 so lets ensure we have this installed:
yarn add react@18 react-dom@18
Let’s add ReGraph to the project. Once you’ve signed up for a free ReGraph trial and downloaded it, copy the file to the project directory. Now run:
yarn add ./regraph-#.#.#.tgz
We’ll do the same for the Elastic UI components:
yarn add @elastic/eui @elastic/eui-theme-borealis @elastic/datemath @emotion/react @emotion/css moment
We have the building blocks in place, but the application doesn’t do anything interesting yet.
Let’s add a page template using the Elastic UI components.
Customize the page
Elastic UI provides a set of helpful page templates which offer an easy way to create different page layout patterns.
You can also build the page yourself by stringing together various components, but we’ll go for the quicker option and use a template.
To the root component app.jsx file, first we add various imports:
import { EuiPageTemplate, EuiSideNav, EuiButtonGroup } from "@elastic/eui";
And now, instead of the image that ViteApp returns, we’ll edit the App function to return a page template:
 return (
   <EuiPageTemplate
     style={{ minWidth: "100vw", minHeight: "100vh" }}
     restrictWidth="100vw"
     paddingSize="m"
   >
     <EuiPageTemplate.Sidebar />
     <EuiPageTemplate.Header pageTitle="Elastic UI ReGraph Example" />
     <EuiPageTemplate.BottomBar paddingSize="s" />
   </EuiPageTemplate>
 );
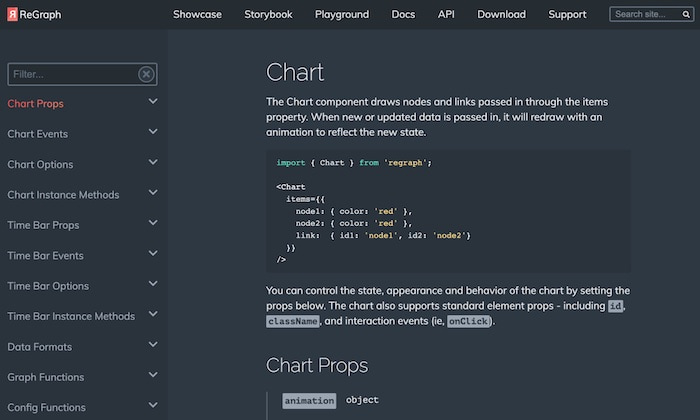
This is the default page template with a header, a sidebar, a bottom bar, and the main area for content, which is a common page layout. In fact, although we don’t use the Elastic UI framework on our ReGraph SDK site, it follows a similar style:
We now have our page template. It’s empty apart from the header we defined in the template itself using the pageHeader property.
Add a ReGraph chart
Let’s add a ReGraph chart to the main body of the page. First, we import it:
import { Chart } from "regraph";
I created a rg_data.js file of graph data which contains an Al-Qaeda terrorist network. We import that next:
import { rg_data } from "./data/rg_data.js";
Add the chart to the content of the page within the JSX file. This will be inside an Eui Section component.
 <EuiPageTemplate.Section>
       <Chart
         style={{ height: "80vh", width: "100vw" }}
         items={filteredItems}
         options={chartOptions}
         combine={combo}
         layout={layout}
       />
     </EuiPageTemplate.Section>
To store them in state, we use React hooks for the props for items, layout, and combos:
 const [allItems, setallItems] = useState(rg_data);
 const [filteredItems, setFilteredItems] = useState(rg_data);
 const [combo, setCombo] = useState({ level: 0, properties: [] });
 const [layout, setLayout] = useState({ name: "organic" });
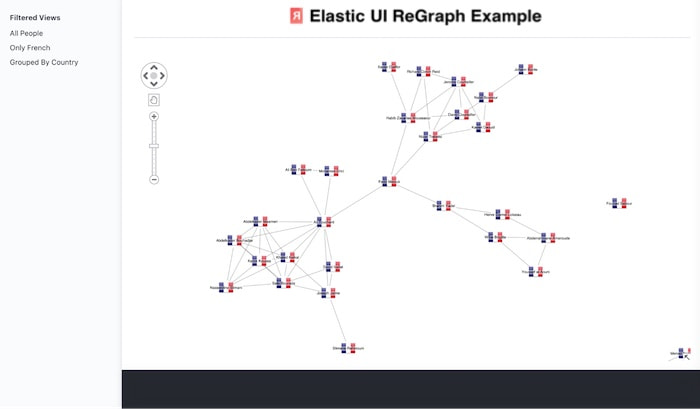
Here’s our first ReGraph chart on the Elastic UI page:
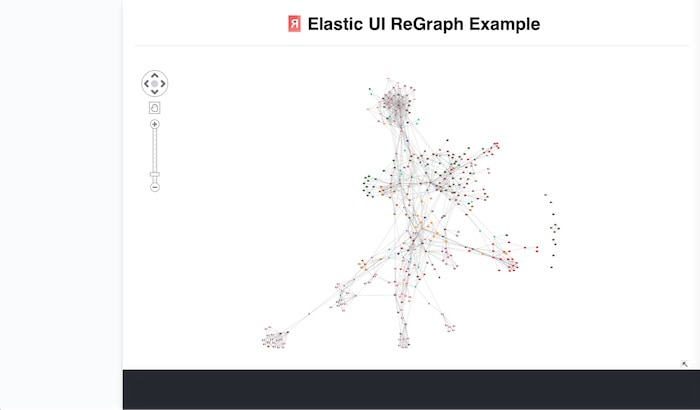
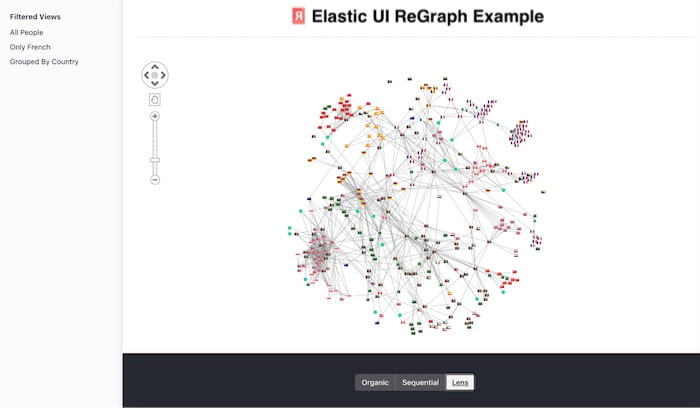
At this stage, there’s no helpful way to interact with it. Let’s turn our attention to UI controls.
Add UI controls
ReGraph natively lets us pan and zoom the chart, but we want to use some of its interactive features that make graph visualization so powerful.
Let’s add some common interactions. We’ll use the sidebar to control the items on the ReGraph chart, and the bottom bar to control the layout.
The Elastic Side Bar control – EuiSideNav – takes an array of items with an onClick event handler for each one. We’ll keep it simple and add two chart filters:
- one to show Al Quaeda terrorists from France only
- another to group terrorists by their country of origin
const sideNav = (
    <EuiSideNav
     mobileTitle="Nav Items"
     items={[
       {
         name: "Filtered Views",
         id: "RootID",
         items: [
           {
             name: "All People",
             id: "everybody",
             onClick: chartFilterAll,
           },
           {
             name: "Only French",
             id: "french",
             onClick: chartFilterFrance,
           },
           {
             name: "Grouped By Country",
             id: "grouped",
             onClick: chartCombos,
           },
         ],
       },
     ]}
   />
Each list item refers to a function for the onClick interaction, so next we’ll provide those functions. Hooks for filteredItems and allItems come in handy here.
We keep the allItems property to refer to the entire dataset but point ReGraph at the setFilteredItems list which we manipulate in our code to show only the items of interest. So to visualize just the people from France, we do this:
  const chartFilterFrance = () => {
   let newItems = {};
   Object.keys(allItems).forEach((x) => {
     if (allItems[x].id1 || allItems[x].data.country === "France") {
       newItems[x] = allItems[x];
     }
   });


   setFilteredItems(newItems);
   setCombo({ level: 0, properties: ["country"] });
 };
We’re only filtering nodes here. We let links through since ReGraph automatically filters out any links that point to node IDs that aren’t displayed in the chart.
To stop filtering and return to the initial state is easy – we just change setFilteredItems back to allItems:
 const chartFilterAll = () => {
   setFilteredItems(allItems);
   setCombo({ level: 0, properties: ["country"] });
   setLayout((layout) => ({ ...layout })); //pass a new layout prop to ensure a layout
 };
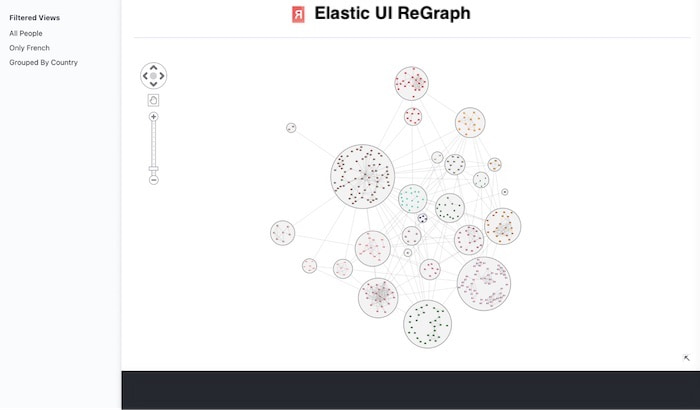
Now for the ‘combos’, ReGraph’s node grouping feature. You can group by any common property – you just need to tell ReGraph which function should set the combine property to an object. Here we set country as the basis for the combos:
 const chartCombos = () => {
   setFilteredItems(allItems);
   setCombo({ level: 1, properties: ["country"] });
   setLayout((layout) => ({ ...layout })); //rerun a layout
 };
Adding layout options
We’ll use the Elastic UI bottom bar to control the layout of the chart.
There are many automatic layouts available in ReGraph. Our app will support three:
- organic layout for detangling big datasets and revealing overall structures
- sequential layout for communicating tiers or layers of information
- lens layout to help users find well-connected nodes fast
An Elastic UI button group makes sense here as it’s a simple way for users to change the layout and be sure which one is currently selected. There’s even a ghost color option designed for buttons against dark backgrounds like ours.
We use a React hook for the layout, which is the prop that gets passed to ReGraph:
 const toggleButtons = [
 {
   id: `organic`,
   label: "Organic",
 },
 {
   id: `sequential`,
   label: "Sequential",
 },
 {
   id: `lens`,
   label: "Lens",
 },
];


 <EuiButtonGroup
 className="layout-buttons"
 legend={"Layout"}
 options={toggleButtons}
 idSelected={layout.name}
 onChange={(id) => {setLayout({ name: id })}}
 buttonSize="m"
 type="single"
/>
Now users can switch easily between layouts:
Use Elastic UI & ReGraph
Building a React graph application often involves mundane tasks like setting up page templates and adding UI elements to allow the user to interact with the graph.
The Elastic UI design library makes it easy to manage those essential elements. With ReGraph taking care of the visualization, you’ll go from an empty project to a powerful, interactive graph visualization application in no time!
Why not give it a try with your own dataset?
Share:
