Building an end-to-end supply chain geospatial network analysis demo in MapWeave
Jan Girman Product Manager
10th December, 2025 | 10 min read
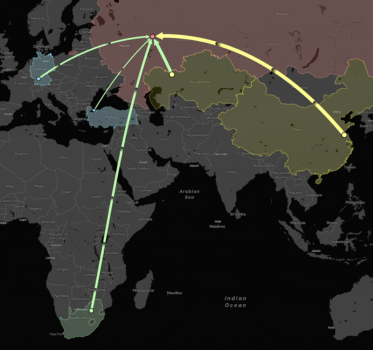
Discover how geospatial network analysis eliminates the compromise between strategic and tactical supply chain...