Tailwind CSS tutorial for graph visualization
Ivan Krushkov Commercial Development Lead
16th December, 2025 | 12 min read
In this Tailwind CSS tutorial, we’ll show you how to customize your ReGraph app and achieve the designs you want...
Ivan Krushkov Commercial Development Lead
16th December, 2025 | 12 min read
In this Tailwind CSS tutorial, we’ll show you how to customize your ReGraph app and achieve the designs you want...

Andrew Disney Marketing Director
30th January, 2024 | 8 min read
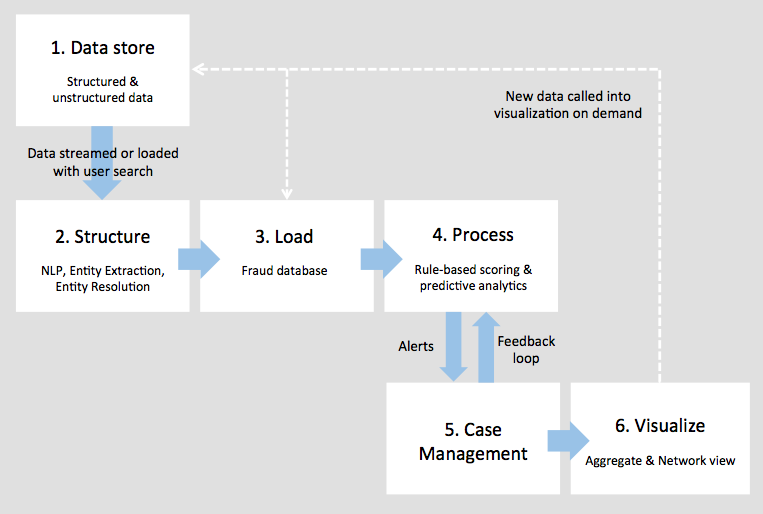
Enterprise fraud management, powered by the visualization-AI intelligence cycle from fraud detection to...

Thomas Chan Software Developer
16th January, 2024 | 8 min read
In this blog post, I show how to use data visualization and AI in a healthcare fraud detection application that...
Andrew Disney Marketing Director
30th January, 2020 | 5 min read
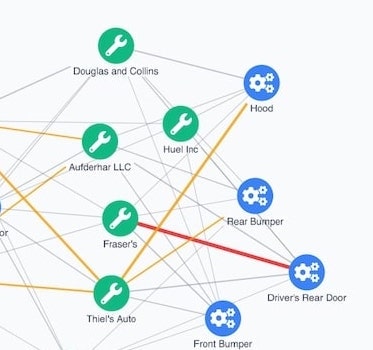
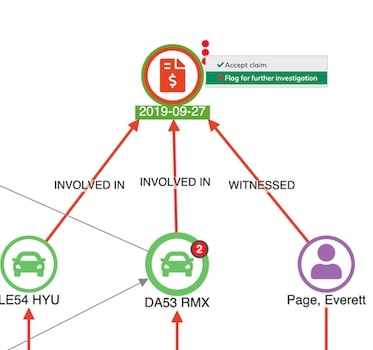
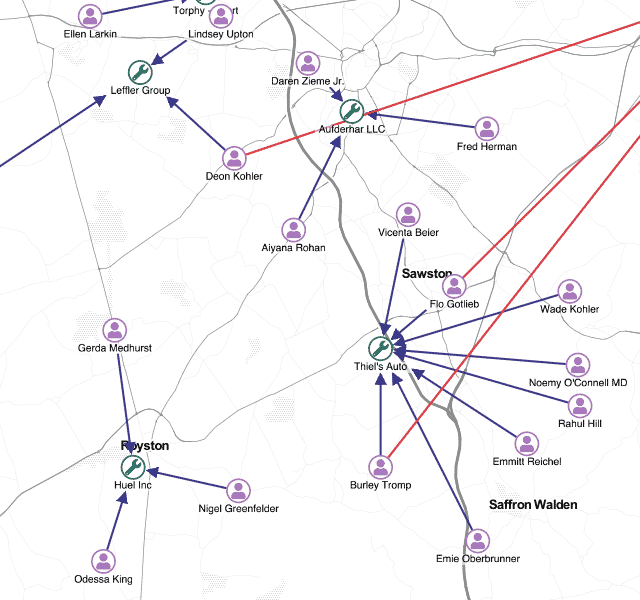
Discover how to use link analysis techniques for fraud detection in this step-by-step example showing typical...
Kevin Naughten Senior Product Manager
15th July, 2019 | 6 min read
Let’s create visual models that deliver the best user experience (UX). Detailed graph visualizations from an...
Andrew Disney Marketing Director
15th November, 2016 | 6 min read
The best fraud detection processes use the right tools at every stage. Find out how important KeyLines and link...
Registered in England and Wales with Company Number 07625370 | VAT Number 113 1740 61
6-8 Hills Road, Cambridge, CB2 1JP. All material © Cambridge Intelligence .
Privacy Policy | Security Framework
