Data visualization with ChatGPT: A developer tutorial
Ryan Shimmon Commercial Software Developer
12th August, 2025 | 10 min read
This tutorial shows how to integrate data visualization with ChatGPT, OpenAI’s large language model (LLM)...
Ryan Shimmon Commercial Software Developer
12th August, 2025 | 10 min read
This tutorial shows how to integrate data visualization with ChatGPT, OpenAI’s large language model (LLM)...
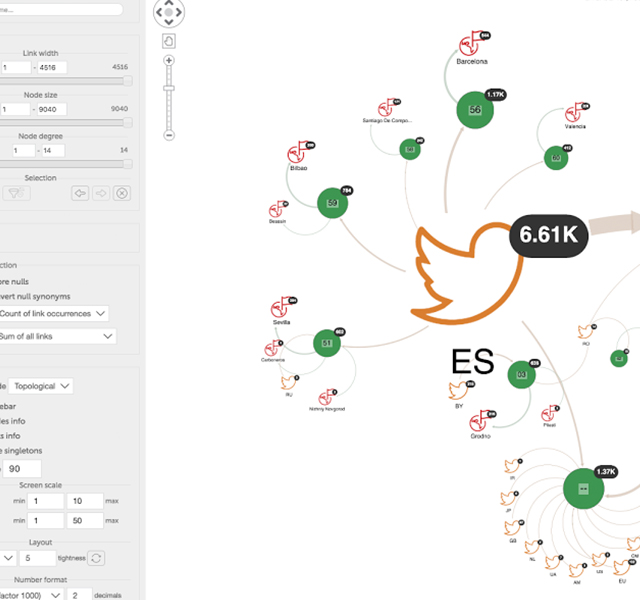
Andrew Disney Marketing Director
5th January, 2021 | 7 min read
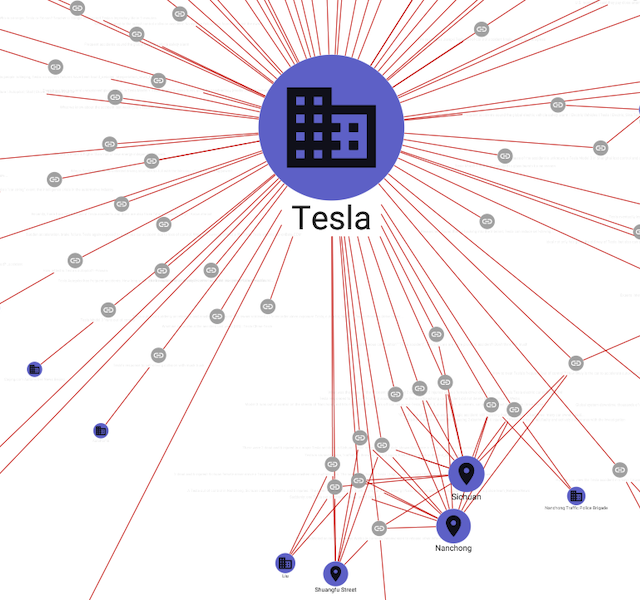
See how Traversals combine search, data fusion, translation, and NLP to produce custom knowledge graphs on any...

Catherine Kearns Content Strategist & Team Lead
18th August, 2020 | 7 min read
Find out how GraphAware’s Hume and KeyLines help the European Space Agency see the power of Natural Language...
Christian Miles VP of Sales
3rd February, 2020 | 10 min read
In this developer tutorial, we’ll use SPARQL to query a DBpedia knowledge graph visualization of connections...

Gizem Unal Head of Marketing
13th January, 2020 | 9 min read
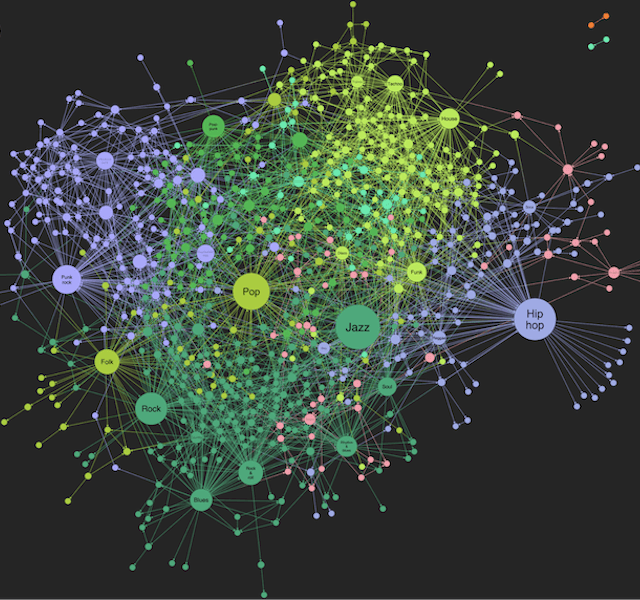
Our graph visualization technology is a particularly good fit for large, complex networks stored as knowledge...
Duncan Grant Sales Engineer
28th January, 2019 | 8 min read
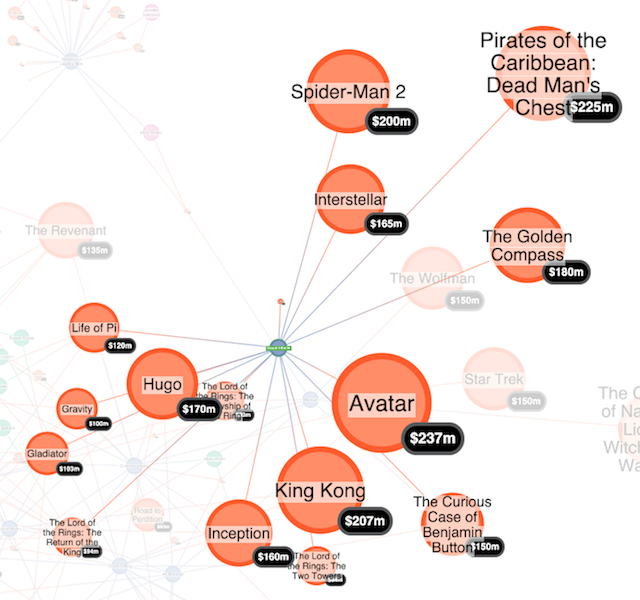
This blog post shows how quick and easy it is to integrate Stardog with KeyLines using Academy Awards data....
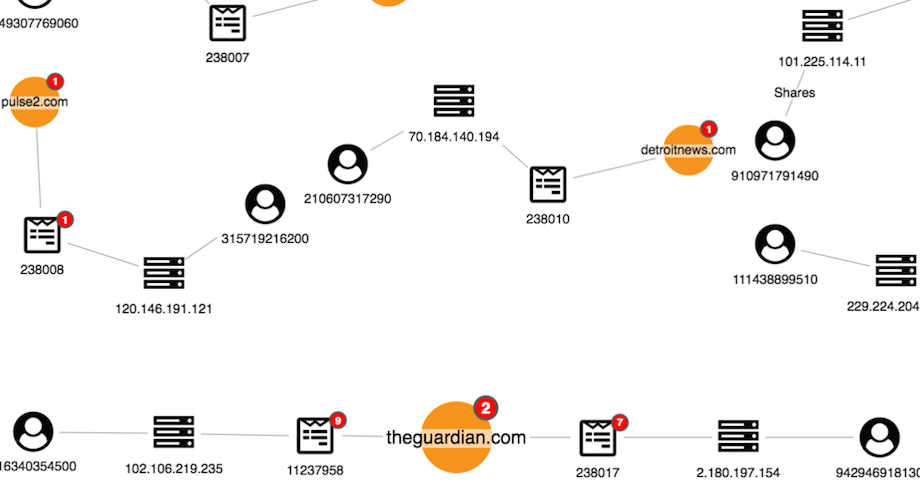
Andrew Disney Marketing Director
28th February, 2017 | 8 min read
Fake news is nothing new – bad journalism and propaganda have always existed – but recent concerns about its...
Andrew Disney Marketing Director
21st February, 2017 | 4 min read
We’ll explore how Devo empowers analysts to harness the connections in their big data, with the help of the...
Registered in England and Wales with Company Number 07625370 | VAT Number 113 1740 61
6-8 Hills Road, Cambridge, CB2 1JP. All material © Cambridge Intelligence .
Privacy Policy | Security Framework
