
How to visualize a customer knowledge graph
Gizem Unal Head of Marketing
13th January, 2020 | 9 min read
Our graph visualization technology is a particularly good fit for large, complex networks stored as knowledge...
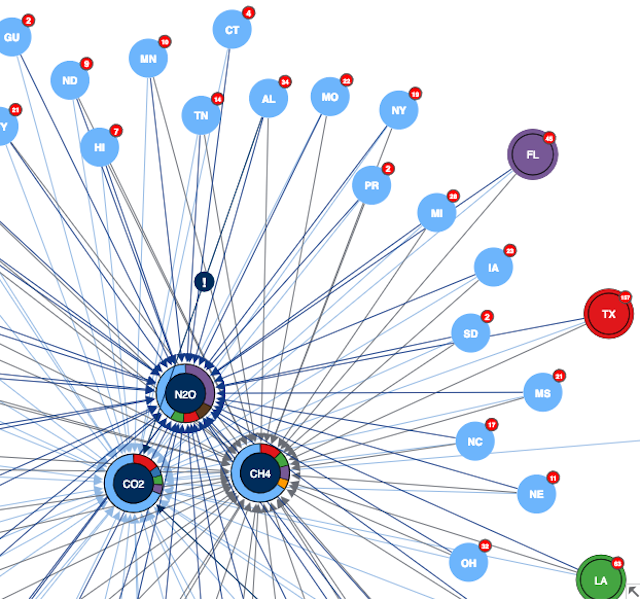
Using KeyLines to visualize greenhouse gas emissions
Gizem Unal Head of Marketing
2nd April, 2019 | 8 min read
In this blog post, a first-time KeyLines user describes their experience of using the graph visualization toolkit...
