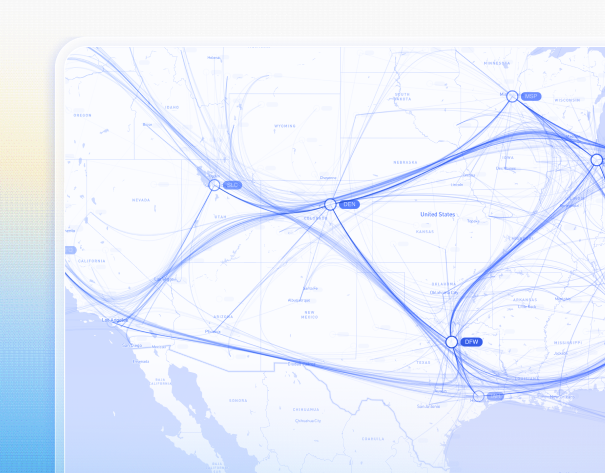
Cybersecurity visualization
Make sense of complex cybersecurity data with interactive graph, timeline and geospatial visualization. Help analysts investigate and respond to threats faster with visual tools purpose-built for cyber workflows.

Trusted by 250+ organizations worldwide




The cybersecurity challenge
Cyber threat analysts face an immense challenge: big, noisy, fast-moving data from cloud infrastructure, identity systems, endpoints, agentic activity, applications and open-source intelligence.
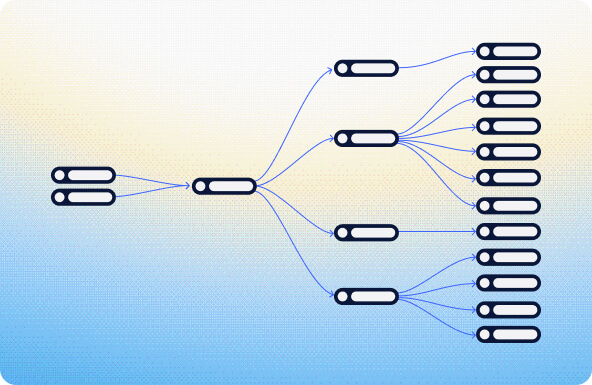
Thousands of alerts are generated every day but only a fraction matter, and failing to spot the right signal fast enough means real organizational risk.
Visualization is how teams regain control and cut through volume and complexity, making it easier to:
- Understand cyber threat intelligence
- Monitor activity across growing cloud estates
- Investigate attacks and uncover root causes
This domain pulls together the key cyber workflows where interactive intelligence – delivered through graph, timeline and geospatial visualization – powers speed, clarity, and better decisions.
Use cases
Visibility
Map what assets, identities and environments you have and how they are connected.
- Asset visibility
- Cloud environment visibility
Predict
Understand where you’re exposed before attackers exploit it.
- Attack path visualization
- IAM/NHI’s identity security
- Application and API risk
- Cloud security posture

Detect
Identify suspicious activity and emerging threats within complex, high-volume data.
- OSINT threat intelligence
- Network traffic and log analysis
- Observability
Respond & Investigate
Give users visualization tools that help them move from discovery to decision – and decision to action.
- Incident response
- Forensic analysis
Build competitive cybersecurity products
Our SDKs are trusted by enterprises and loved by startups.

-
Stand out with visual experiences
Deliver high-impact, fully customizable visualizations that turn complex cybersecurity data into intuitive, differentiated user experiences your customers remember.
-
Help analysts understand and triage threats faster
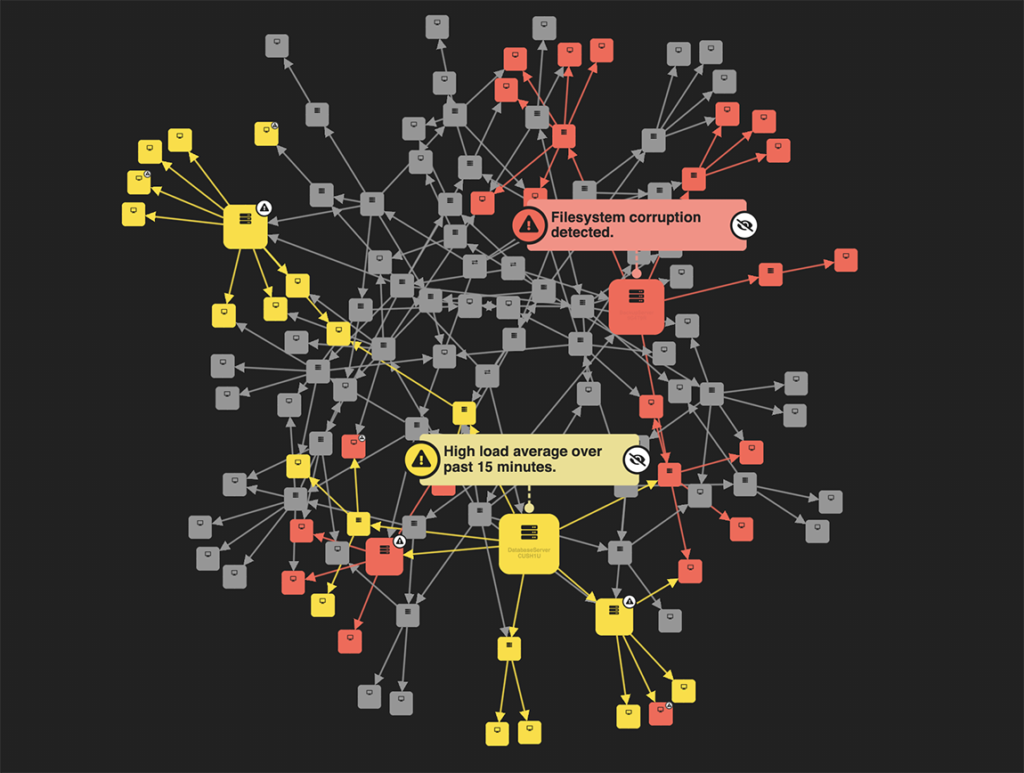
Transform detected alerts into clear, interactive views that add context and explain impact so teams can prioritise and act with confidence.
-
Turn AI outputs into explainable, visual narratives
Support your AI models with visual context that make insights easier to trust, investigate and communicate.
-
Give users full context across complex environments
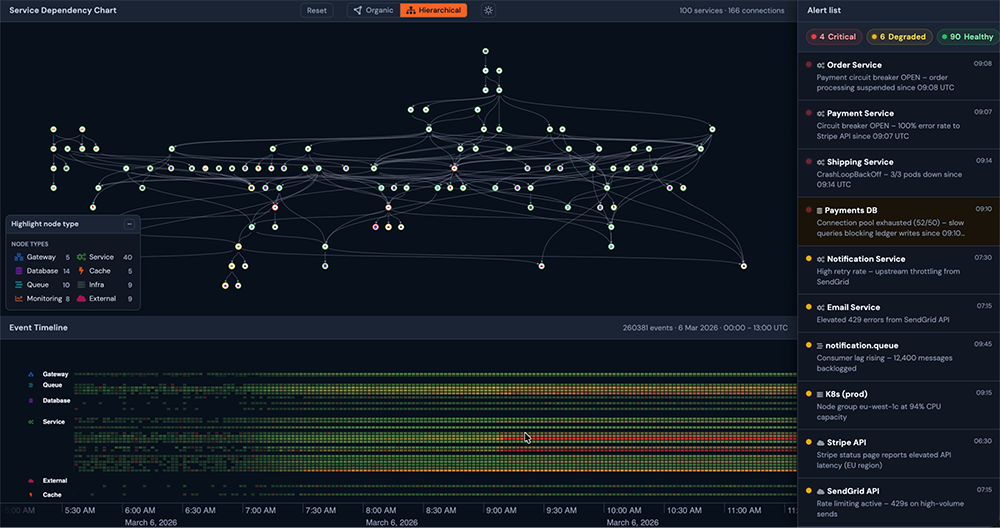
Combine network and timeline views to help users move from isolated alerts to complete understanding of events, dependencies and impact.
-
Design for your market and brand
Fully control styling, interaction and UX so your product reflects your brand and meets the expectations of your customers.
-
Scale with confidence in mission-critical envionments
Deploy high-performance visualizations proven in cybersecurity platforms that handle large, complex datasets without compromising usability.
Cybersecurity demos
Explore these interactive demos in your browser when you request a trial.
Graph visualization for cybersecurity
Watch how connected-data visualization supports threat intelligence and cybersecurity investigations.
Prefer to read? View the full transcript
Build a cloud security visualization app
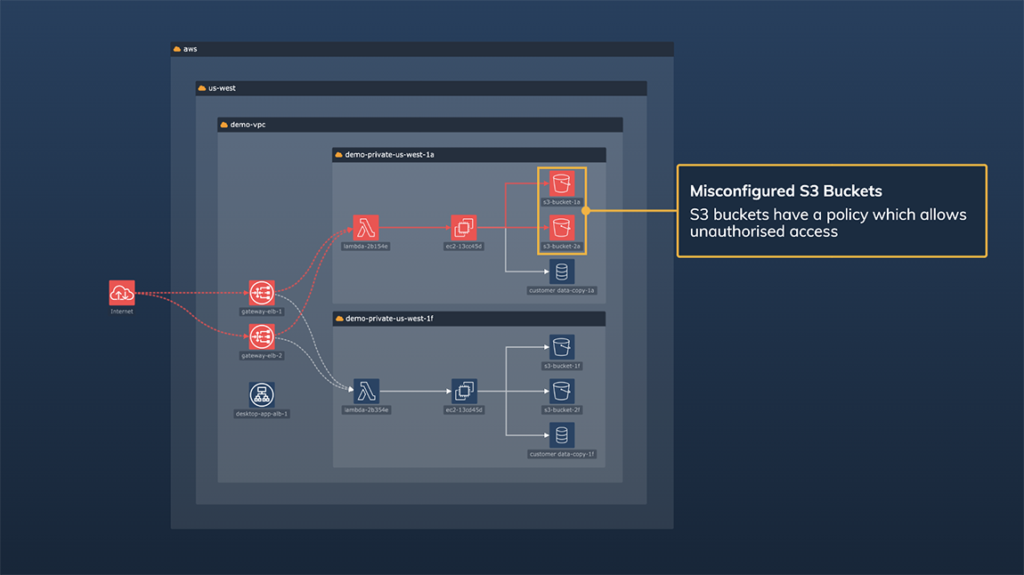
Follow a practical tutorial using Google Cloud Spanner Graph and ReGraph to visualize cloud assets, get insight into security posture, and identify attack paths.
How visualization adds context to AI in cybersecurity
Explore how visual context helps teams understand AI-generated alerts and investigate unusual activity.
Frequently asked questions
What types of cybersecurity data can your visualization SDKs handle?
Anything with entities, relationships or temporal events – including alerts, logs, cloud assets, identity data, threat intel feeds, MITRE ATT&CK mappings, and more.
How does visualization help analysts prioritize alerts?
Graph and timeline views reduce noise by exposing patterns, clusters, anomalies and sequences that matter, helping analysts focus on high-impact events faster.
How customizable are the visualizations?
Fully. You can tailor layouts, styling, interactions and UX to match your application and user needs, whether for an analyst-heavy SOC or a commercial UI.
Do you provide implementation guidance for cyber use cases?
Yes. We offer sample code, MCP server, API reference and full documentation to speed up development.
See more use cases
Ready to visualize your connected data?
Bring clarity, confidence and interactive intelligence to your product – with visualizations that transform how users understand and explore complex data.