
This blog post shines a spotlight on the MITRE ATT&CK framework. I’ll demonstrate how to add it to your data visualizations and power your most effective cybersecurity strategy.
What is the MITRE ATT&CK framework?
The framework is a knowledge base and formal language used in the cybersecurity industry to represent the tactics and techniques used by attackers.
The focus on adversarial behaviors is key. MITRE believes that the best way to find and prevent cyber threats is by emulating breach scenarios, using offense as the best driver for defense. The result is a set of tried and tested techniques that every cybersecurity team can apply in any breach scenario.
The framework also gives researchers and analysts a common language for describing cyber attacks.
The anatomy of a cyber attack
Whenever you see a report on a cyber breach or hack, you’ll find references to the MITRE ATT&CK framework. For example, the 2021 Colonial Pipeline ransomware attack has been analyzed in detail by many. The attackers used the DarkSide ransomware-as-a-service, and Trend Micro’s report on the incident includes a detailed breakdown of the ATT&CK tactics and techniques employed.
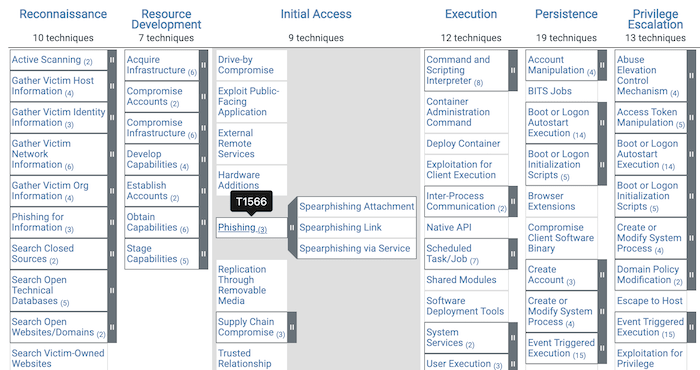
The MITRE ATT&CK framework is broken down into columns representing the phases of an attack. Here’s an example scenario:
-
- Attackers start with a Reconnaissance phase, then make an Initial Access attempt.
- As their attack develops, they use Lateral Movement and Privilege Escalation to get to where they need to be in the victim’s system.
- The end goal is the encryption and Exfiltration of files for extortion purposes.
Inside each of these phases are the detailed techniques and sub-techniques used, with a unique ID assigned to each technique. For example, T1566 is the Phishing technique, which is used by DarkSide to gain initial access to a system.
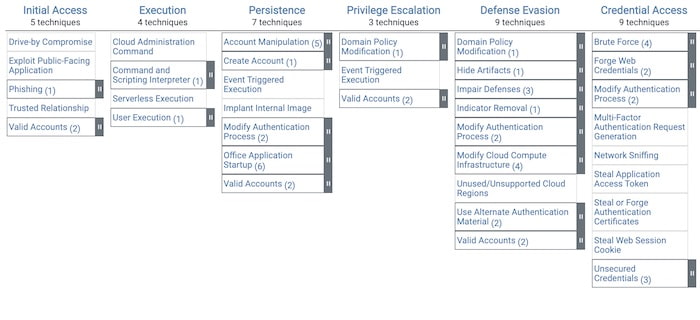
There’s also a matrix covering cloud-based techniques. Here’s a snapshot:
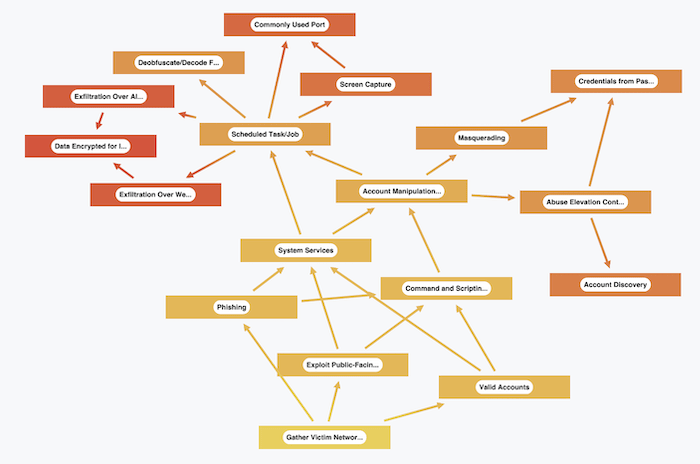
MITRE ATT&CK framework as a dependency graph
I built a simple graph model of a set of techniques, where:
- nodes are the individual elements of the ATT&CK matrix.
- links represent cause and effect. For example, I can link T1053 (Scheduled Task/Job) to T1544 (Remote File Copy) if attackers were abusing a task scheduler to ensure the regular execution of malicious code for making copies of files.
Taking some of the techniques described in the Trend Micro report, I recreated the anatomy of a DarkSide ransomware attack using this model. Next I visualized it using KeyLines – our graph visualization toolkit for JavaScript developers, (although I could have used ReGraph, our SDK for React developers).
To create my nodes, I downloaded the latest version of the ATT&CK JSON file, which has all the IDs and labels I need.
I used KeyLines’ custom styling to assign different colors to nodes in each of the different columns of the matrix. Then I added links using the information from the Trend Micro report.
It’s a useful visual representation of what took place, and it helps us spot dependencies. We can see what impact a mitigation or fix to a particular vulnerable process might have on the ability for the attackers to move to a subsequent phase.
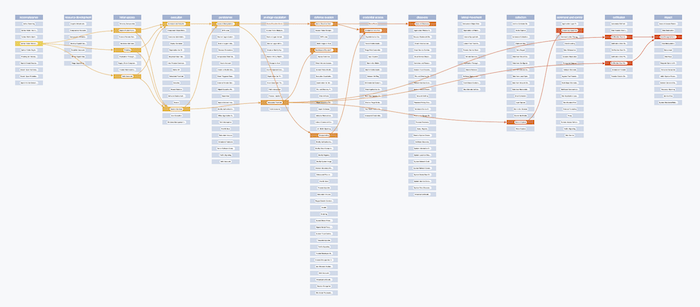
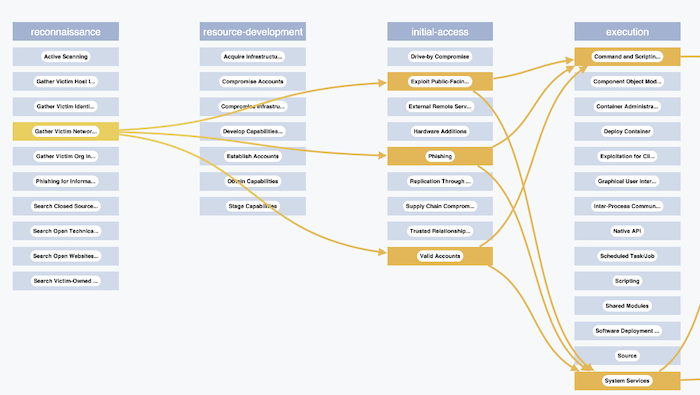
Recreating the ATT&CK matrix in KeyLines
For a bit of visual excitement – and to help analysts understand this dependency graph in the context of the familiar MITRE ATT&CK framework – I tried to replicate the matrix in its original form using KeyLines. To do this, I need a custom layout.
KeyLines comes with a number of off-the-shelf layouts for arranging graphs. The example above uses our organic layout which is a great way to see the structure of your network, and scales brilliantly when you need to arrange huge networks.
We have many other automatic graph layouts, but we don’t have one that replicates the MITRE ATT&CK framework.
To make a custom layout, simply add your calculated x and y coordinates to each node, and then ask the graph to animate to the new positions. I calculate these using their position in the ATT&CK matrix. I also create some dummy ‘header’ nodes which label the columns of the matrix, and put these in the zero (top) position.
The DarkSide graph uses only a small fraction of the total list of techniques in the MITRE ATT&CK framework. So the final step of my animation is to fade in the other cells to help the user see the attack in its full context.
Here’s the final result – an animated transition from the graph view to the matrix view.
One advantage of seeing the full matrix is that it reveals the techniques DarkSide uses alongside the techniques it doesn’t use. This helps organizations assess their own readiness for a targeted attack, using visualizations like these as a playbook to run scenarios and test defenses.
ATT&CK as a timeline
The arrows in our dependency graph give a crude picture of cause and effect. But if you’re carrying out a detailed forensic analysis of an attack, then this picture doesn’t go far enough. That’s where timelines come into their own.
Detailed timelines of cyber attacks are typically complex. To provide context and a high-level understanding of what’s happened, you can visualize individual events alongside ATTACK phases.
Here’s a timeline I created using our KronoGraph toolkit showing file transfers to external IP addresses. Within the normal daily pattern of file access, a malicious actor controls the exfiltration of files that they’ve previously archived as part of an attack.
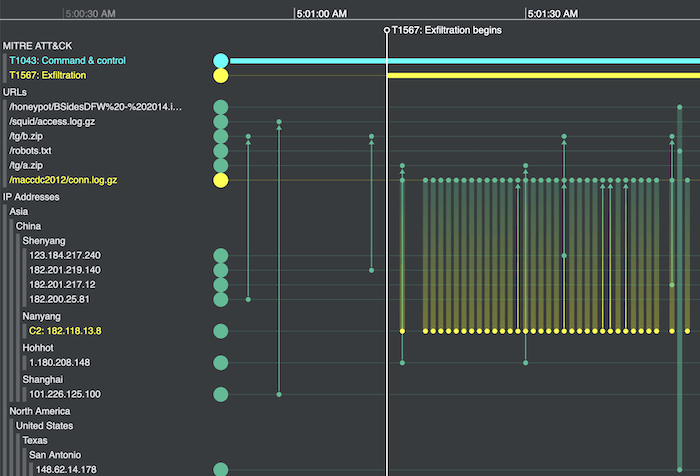
The duration of the Exfiltration Over Web Service phase (T1567) is shown at the top of the timeline. It’s superimposed over a visualization of HTTP requests between external IP addresses (bottom section) and URLs on a fictional company’s website (top section). The attackers have managed to archive sensitive data into a zip file (in yellow) which they’ve made available on the company’s website by exploiting their elevated privileges. The file is now being sent to a Command & Control (C2) server, also shown in yellow.
The ATT&CK phases provide a background level of information to help users understand how the detailed log data (of HTTP requests) fits into the context of an attack.
Find out more
This blog article showed just a few examples of how you might add the language of the MITRE ATT&CK framework to your cybersecurity visualizations.
Have other ideas? Or want a free trial of KeyLines, ReGraph or KronoGraph?
Share:
